The Island of Crete is a tile puzzle game set in the Labyrinth. You are Theseus. Gather every relic, open the Daedalus Gate and reach the exit, while the Minotaur hunts you. He takes two steps for every one of yours, always trying to close the gap across before he tries up or down. That one simple rule is the whole game: you win by reading where he will go and leading him into walls, pits and traps.
The campaign has ten chapters and a hundred levels. Each chapter brings in one new piece of Daedalus’s workshop, teaches it in three short levels, then mixes it with everything before it in seven harder ones. The pieces include gravel the beast can’t cross, walls that rise behind you, false and invisible walls, snares, teleports, rolling bronze balls, Harpies, Talos’s fire, a thief, bombs and a clone machine. There are three tools too: Medusa’s mirror, a wooden cow to lure him, and honey cakes for extra hearts. Story pages hidden in the levels decide which of three endings you get.
Beyond the campaign there is Endless: new levels made on the fly from a seed, so you can share a seed and a friend plays exactly the same run. There is also a level editor, where you can build your own level, check that it can be won, and share it as a link.
Two looks
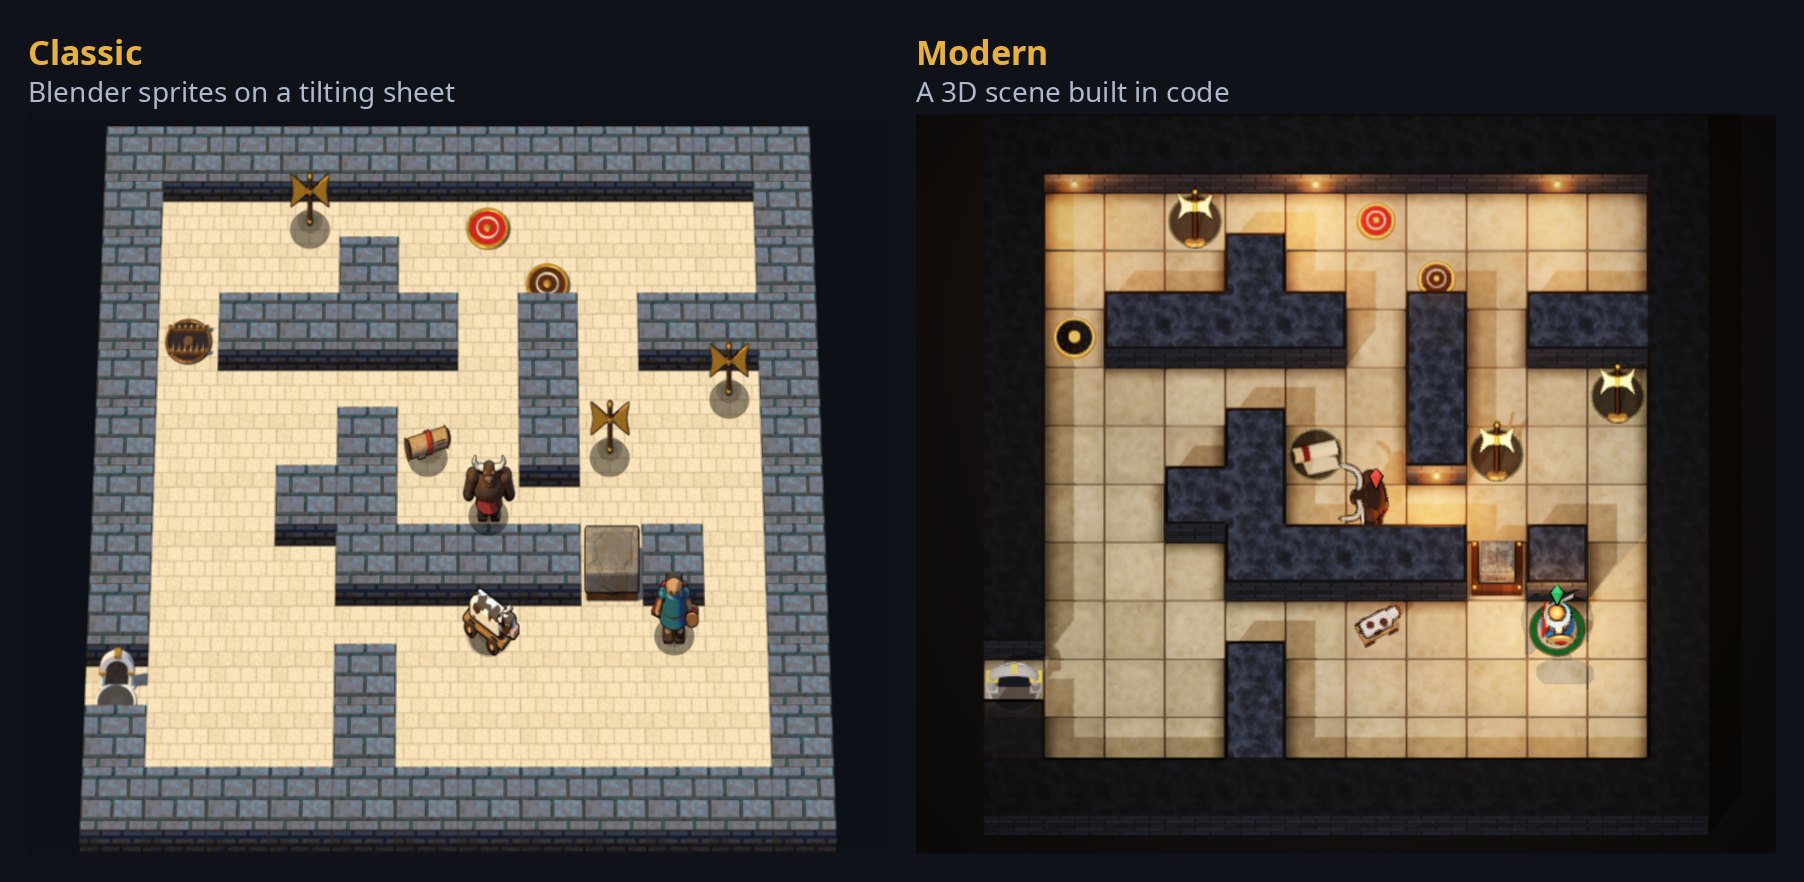
You choose how the Labyrinth looks. Modern is a painted 3D scene with a free camera you turn with a compass. Classic is a flat, hand-rendered board in the spirit of the old tile games. The puzzle is the same in both; only the view changes, and you can switch at any time without losing your place.
How to play
Move: arrow keys or WASD, or the on-screen pad on a phone. A quick tap is one step; hold it to keep walking.
Wait: the period key, or Wait. Sometimes standing still is the move.
Undo and Restart: U and R. Walking back the way you came also takes the moves back.
Stuck? Ariadne’s thread (H) shows the next step of a perfect solution. Using it marks the try as assisted.
Best: every level knows its fewest possible moves. Beat a level in exactly that many for a perfect clear.
Next in this series: how the game was built, and the decisions that shaped it along the way.
I built The Island of Crete by directing a team of AI coding agents (Muse, Cursor and Anthropic’s Claude Code). I set the vision, made the calls and played every build; the agents wrote the code, the tests and the documentation, each in its own copy of the project, and every change went through automated tests and code review before it could go live. From the first draft on October 8 to November 5, that took 22 days of work spread over four weeks; on the other 7 days nobody worked on it. This post is the story of how it was built, in pictures: how the game grew, how it is put together, and how its levels are made, proved and shared.
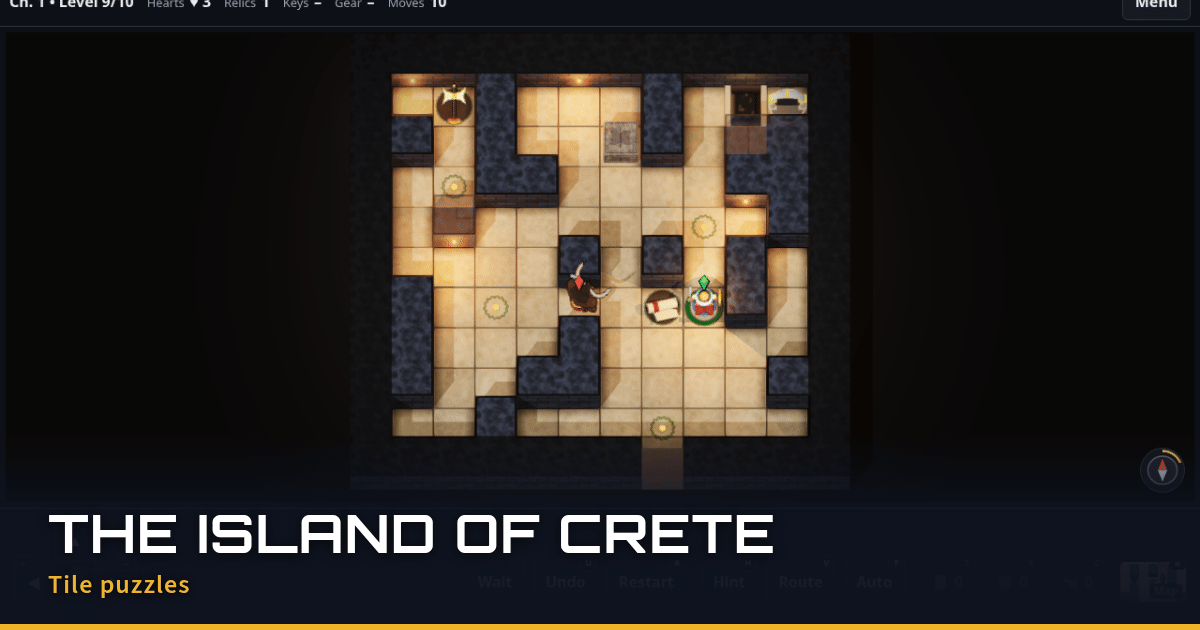
The Modern look today: Chapter 10, a stone labyrinth on pale sand.
From a quick chase to a puzzle game
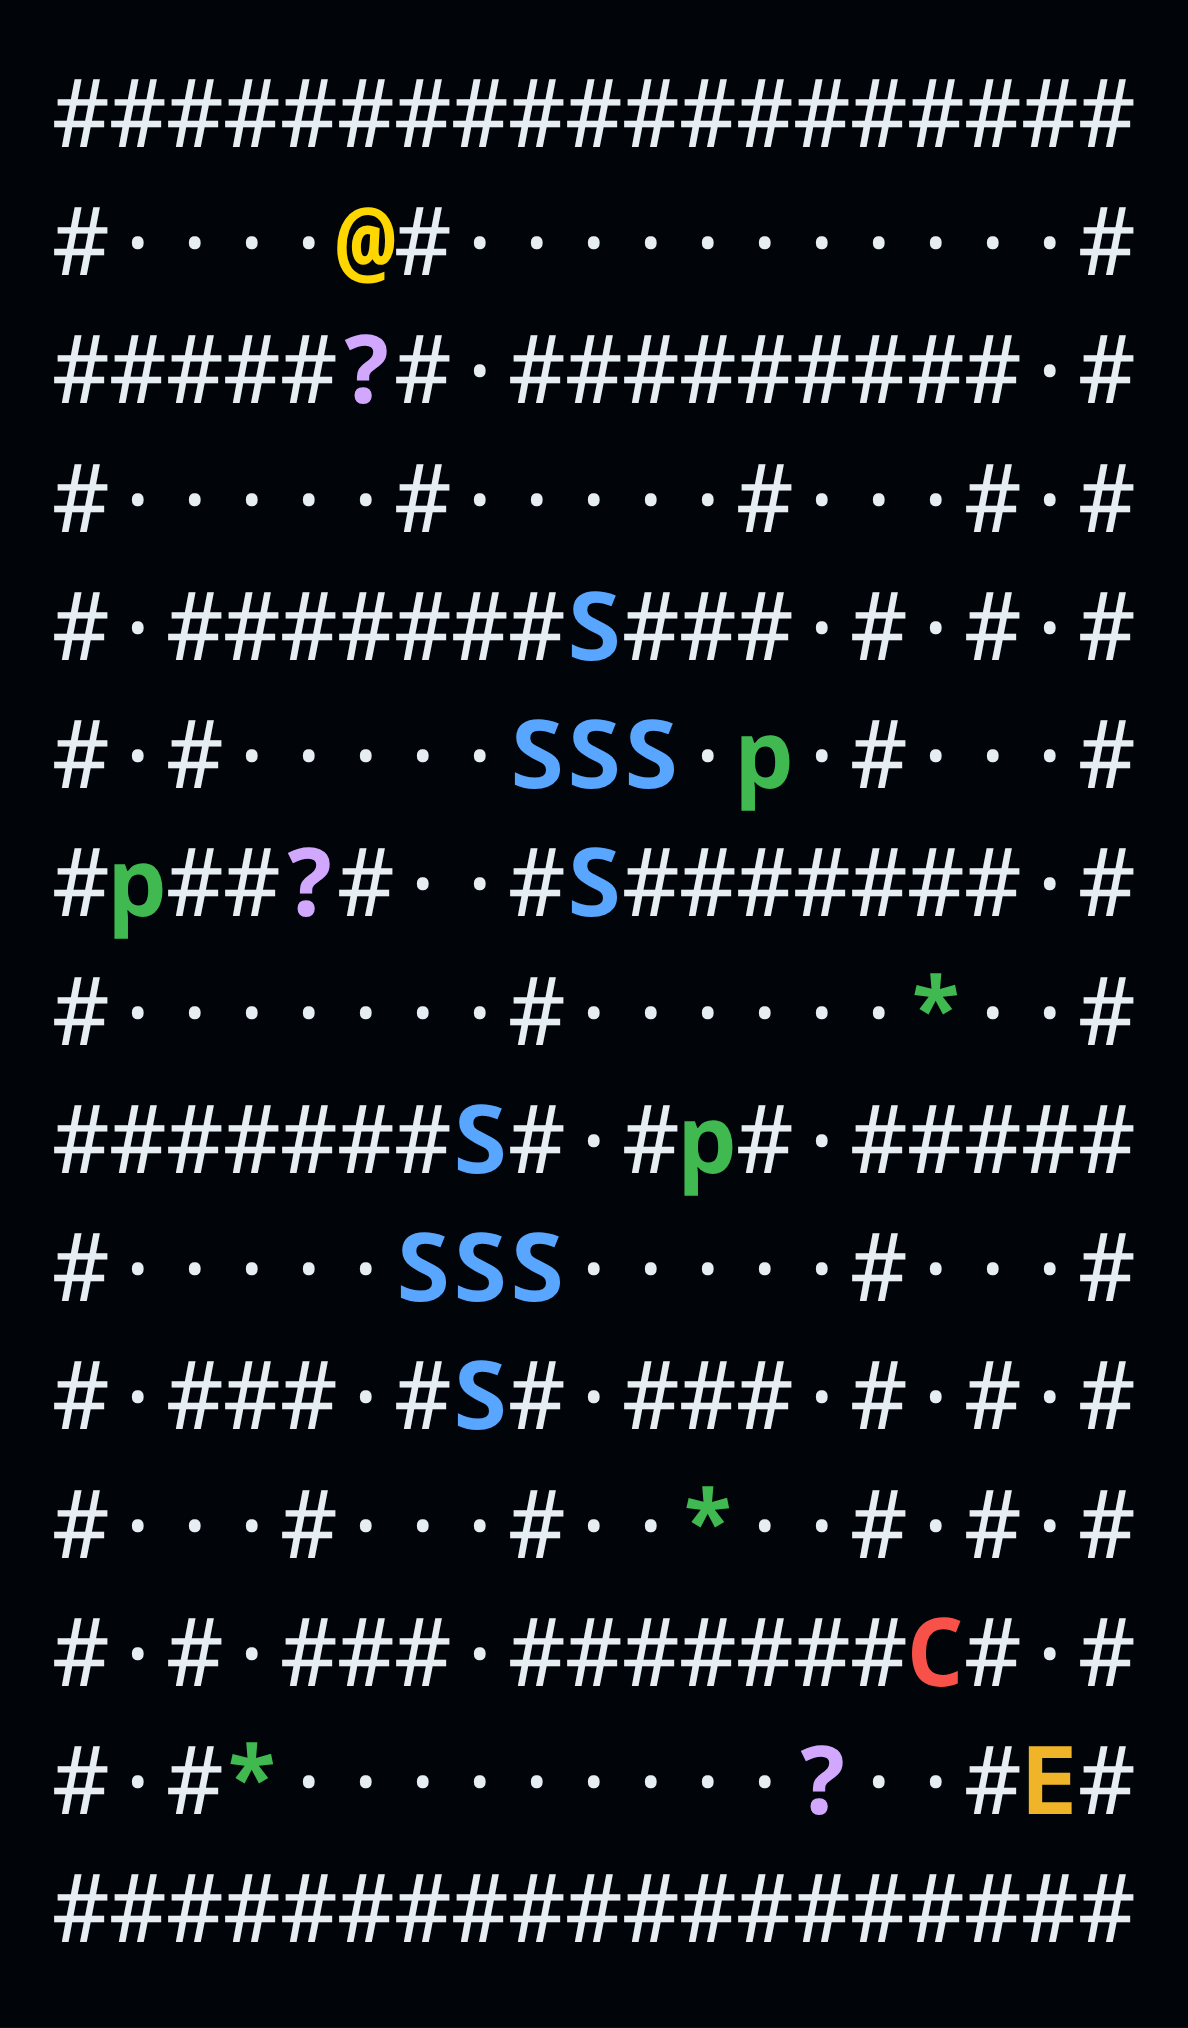
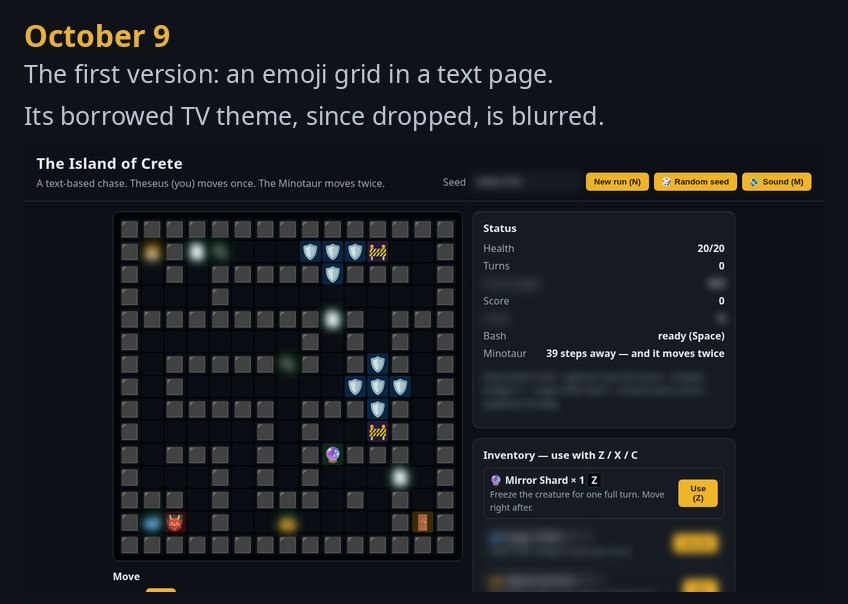
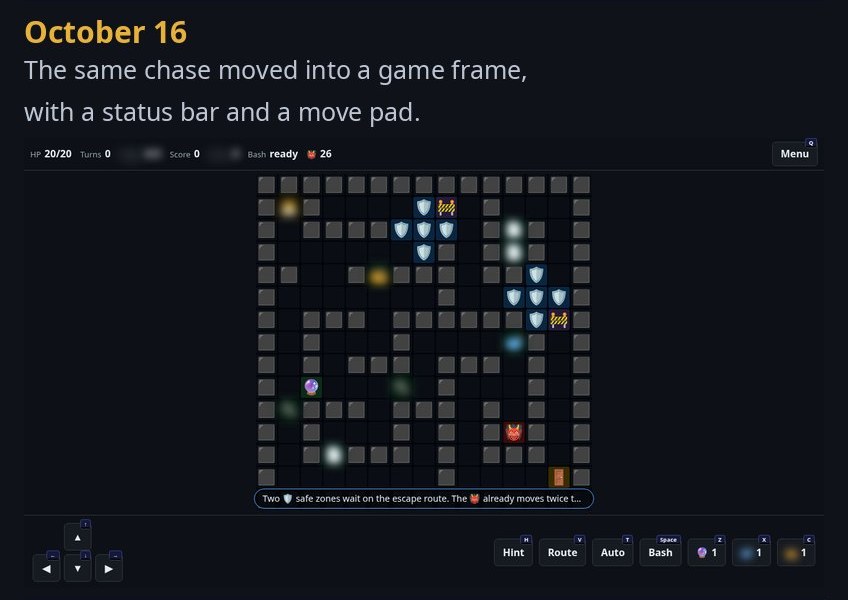
Crete started out crude. The very first draft, on October 8, drew the island in plain text characters: # for walls, E for the exit, @ for you and C for the creature. Within the hour it had switched to emoji, and the first version we kept, on October 9, was an emoji grid on a text page: you moved once, a creature moved twice, and a status panel listed your health and items. It also borrowed its theme from a TV show, which we have since dropped (it’s blurred in the pictures below). A week later the same chase had moved into a proper game frame, with a status bar and a move pad, but it was still emoji on a dark grid.
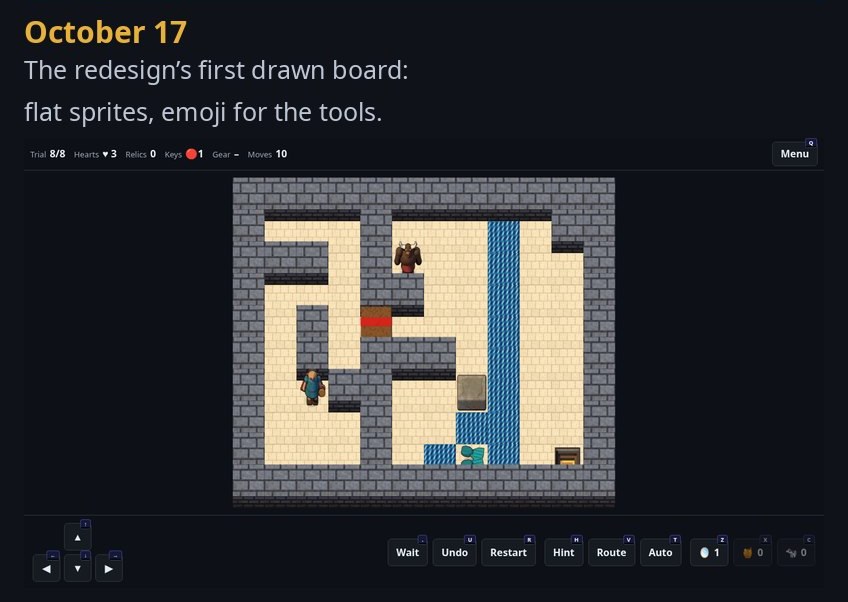
That one rule, two steps for every one of yours, was the seed of everything that followed. That same day, October 16, we redesigned the game around the myth of Theseus and the Minotaur and the classic tile puzzle: one move at a time, nothing moves until you do, and the Minotaur always closes the gap if he can. The first build of the new design, a day later, was still rough: eight trial levels on a flat board, with emoji standing in for the tools.
Today it has a hundred hand-built levels in ten chapters. Each chapter brings in one new piece, teaches it in three short levels, then mixes it with everything before in seven harder ones. The story is told on chapter cards and hidden pages, quoting the old sources word for word from public-domain translations: Plutarch, Ovid, Apollodorus, Catullus and others.
Day one, October 8: the map in plain text.
The First Week
From an emoji grid on a text page to the first drawn board. The borrowed TV theme of the first two is blurred.
Two looks, one game
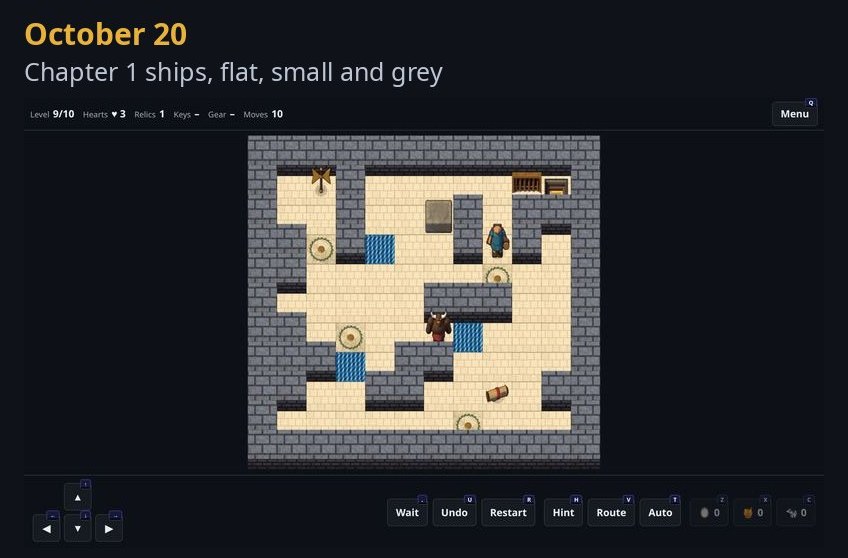
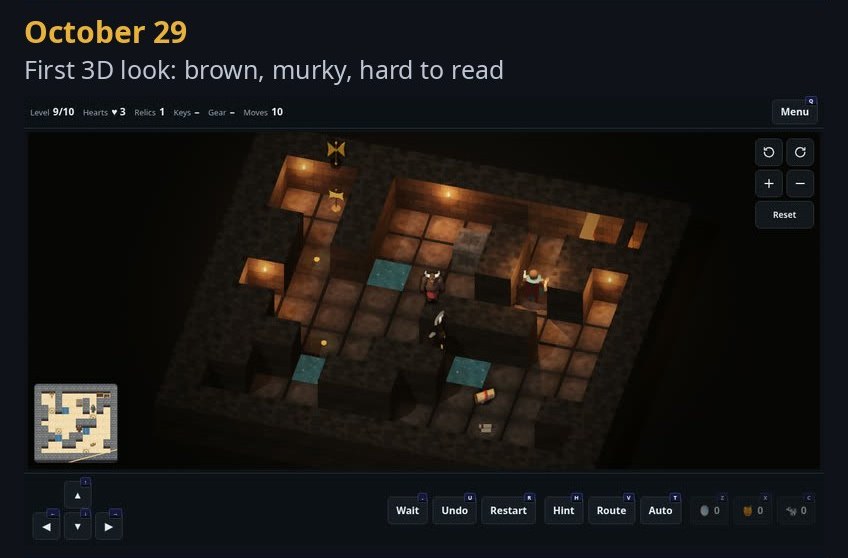
The first drawn version used sprites rendered in Blender, every one built from a scene written in code, with no outside art. That became Classic. Then came Modern, a 3D board you can turn, tilt and zoom, built from shapes and textures generated in code. Its first version, honestly, was a mess: brown, murky and hard to read. Playtesting on a phone pushed it, in a few days, to grey stone and pale sand, then to crisp edges with no blur, so every piece can be named at a glance on a small screen.
One Level, Two Weeks
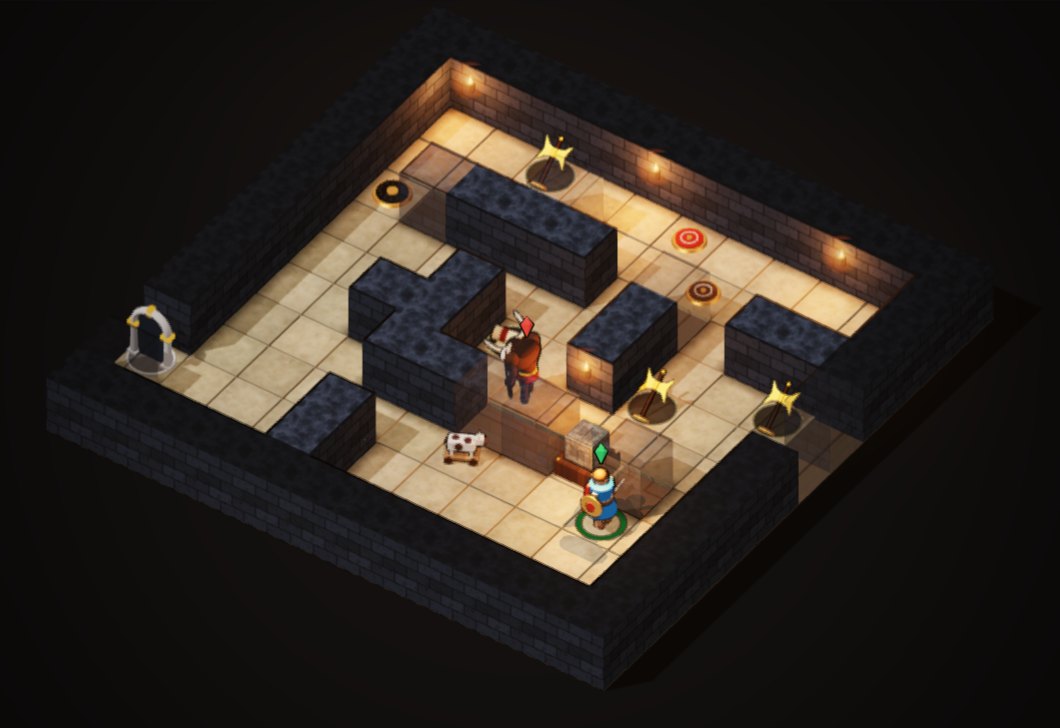
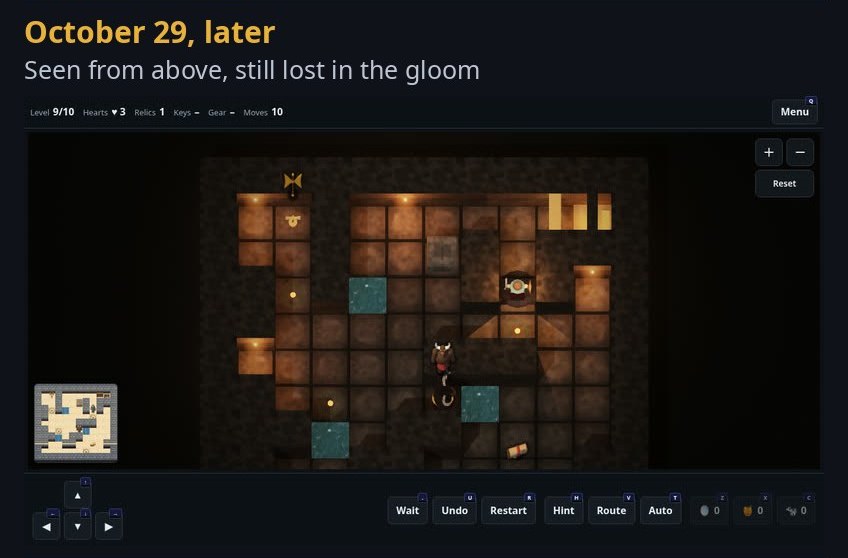
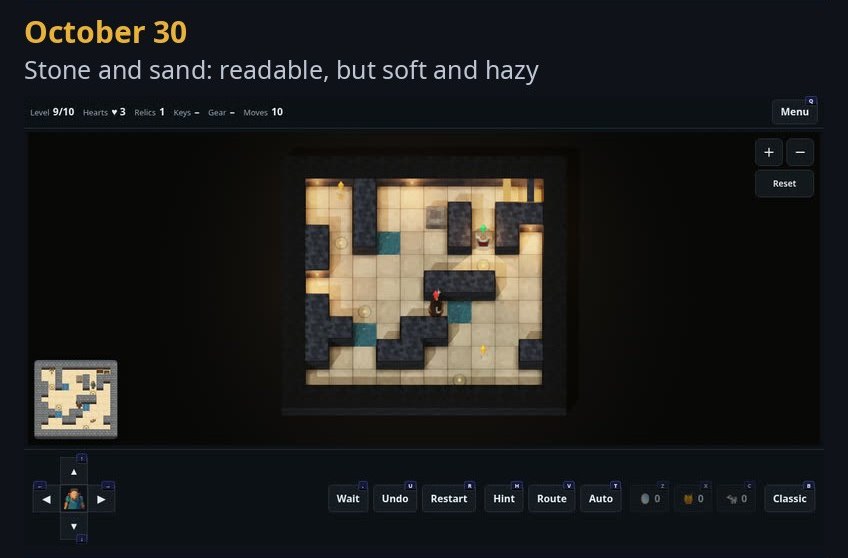
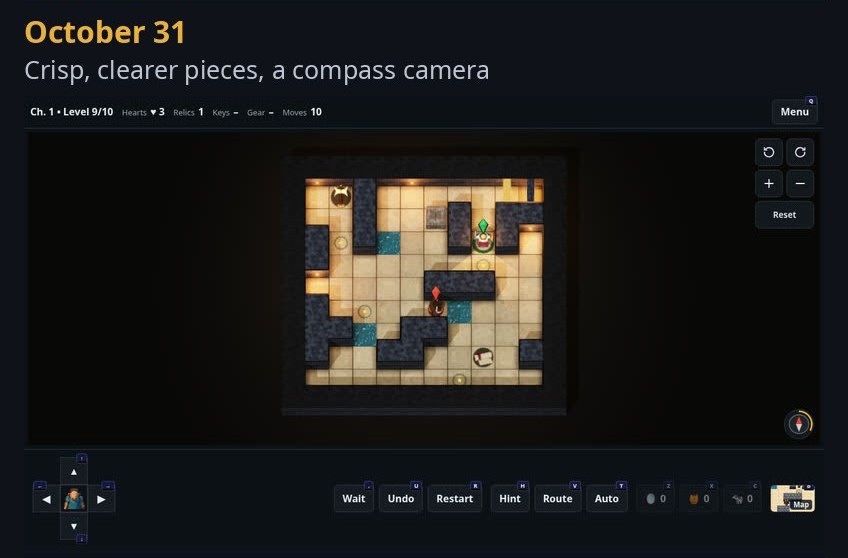
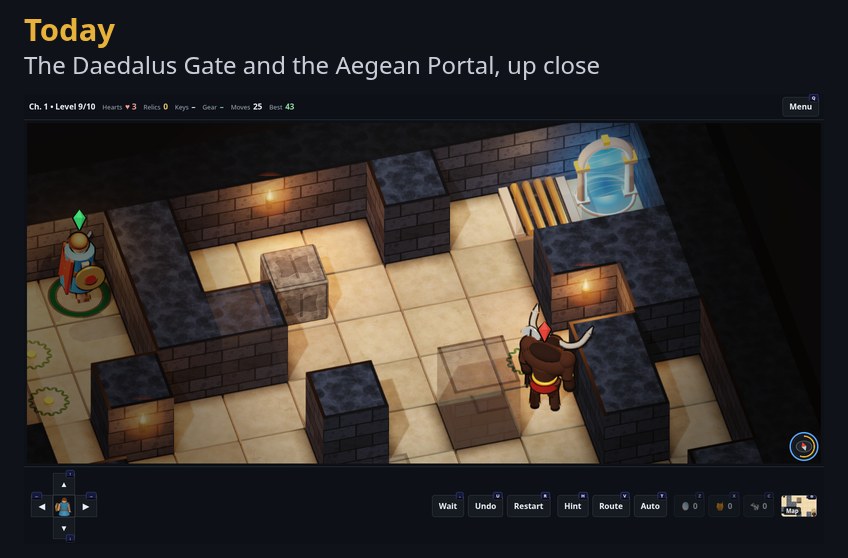
The same Chapter 1 level, ten moves in, as the look changed from October 20 to today: read left to right, top to bottom.
You can swap looks mid-move with the Map button and nothing about your game changes. Classic never loads a 3D engine at all, so it stays light on any computer; Modern is downloaded only when you choose it, and the game falls back to Classic if a device can’t draw 3D. Both share one camera: a compass to turn and tilt, a tap to reset.
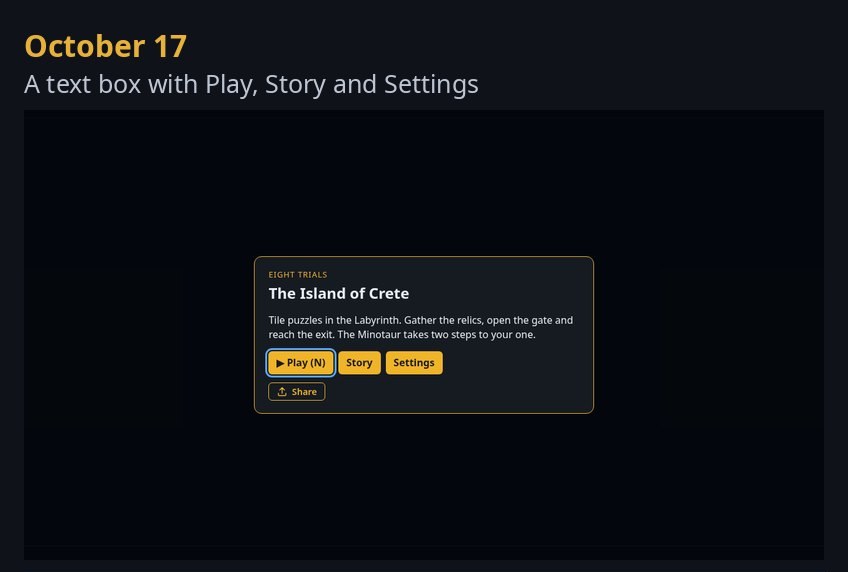
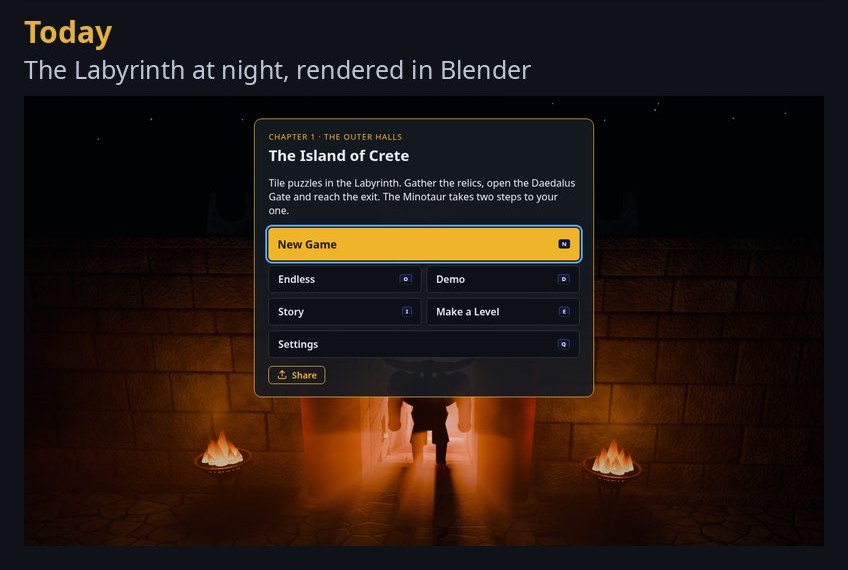
Many small touches came from watching people play. The exit, the Aegean Portal, stays dark until you hold every relic, then light rises up its arch and fills its pool. Bars slide over the Daedalus Gate behind you, and doors sink into the floor as you walk through. The title card is a night scene of the Labyrinth’s entrance, also built and rendered in code.
The same moment of the same level, in Classic and in Modern.
The Title Card, Then and Now
The first title card on October 17, and today's night scene of the Labyrinth's entrance.
Inside the game
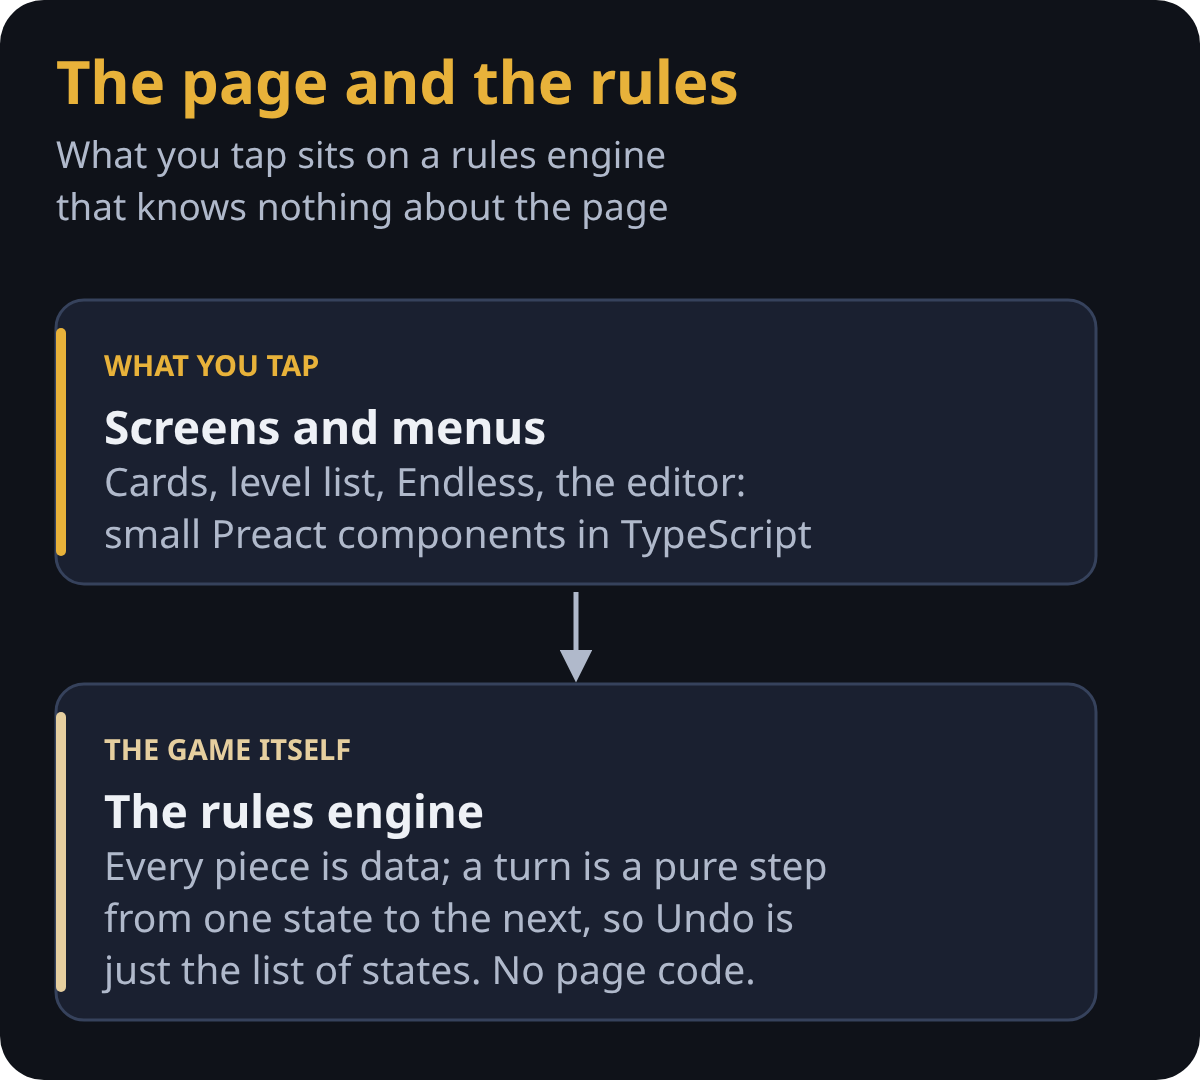
Under the pictures, the game is a few separate parts that never wait on each other. The screens and menus are small Preact components written in TypeScript. Beneath them sits the rules engine, which knows nothing about the page: every piece is data, and a turn is a pure step from one state to the next, so Undo is simply going back a state.
The page and the rules.
What runs off the page.
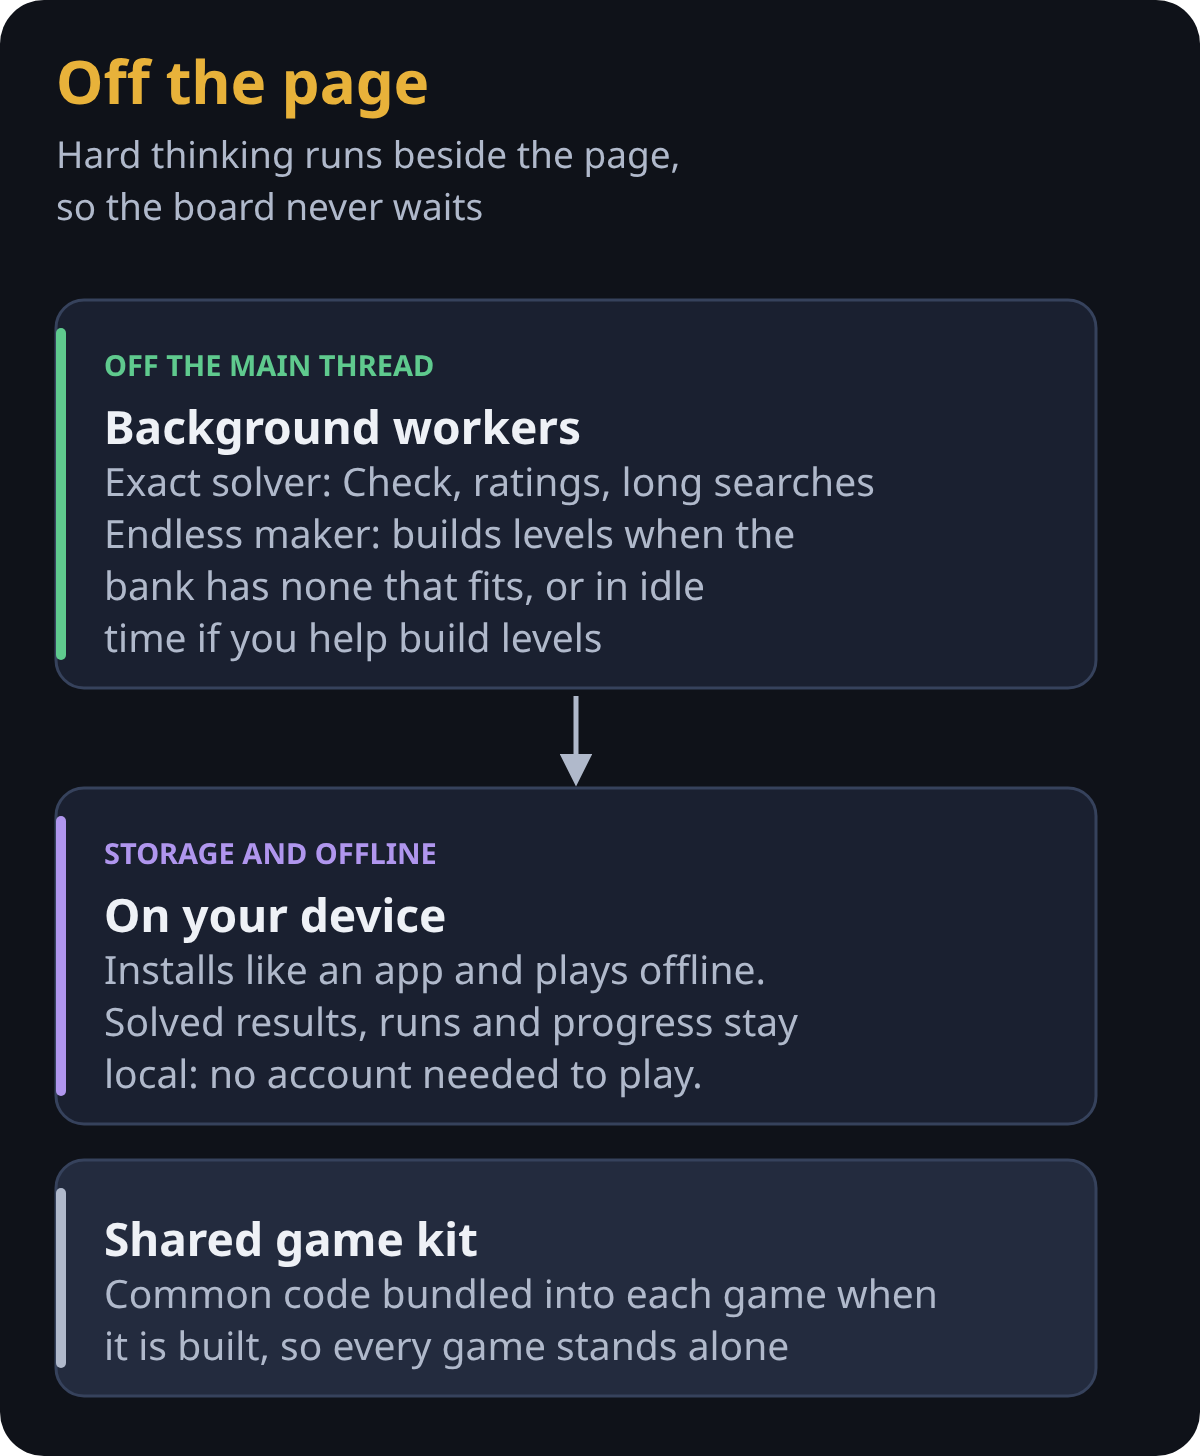
The heavy thinking happens in background workers, off the page, so the board never freezes: one for the exact solver and the editor’s checks, and one that builds your next Endless levels while you play. The game installs like an app, plays offline, and keeps its results, runs and progress on your device. Code shared by all our games lives in a small kit that is bundled into each game when it is built, so every game stands alone.
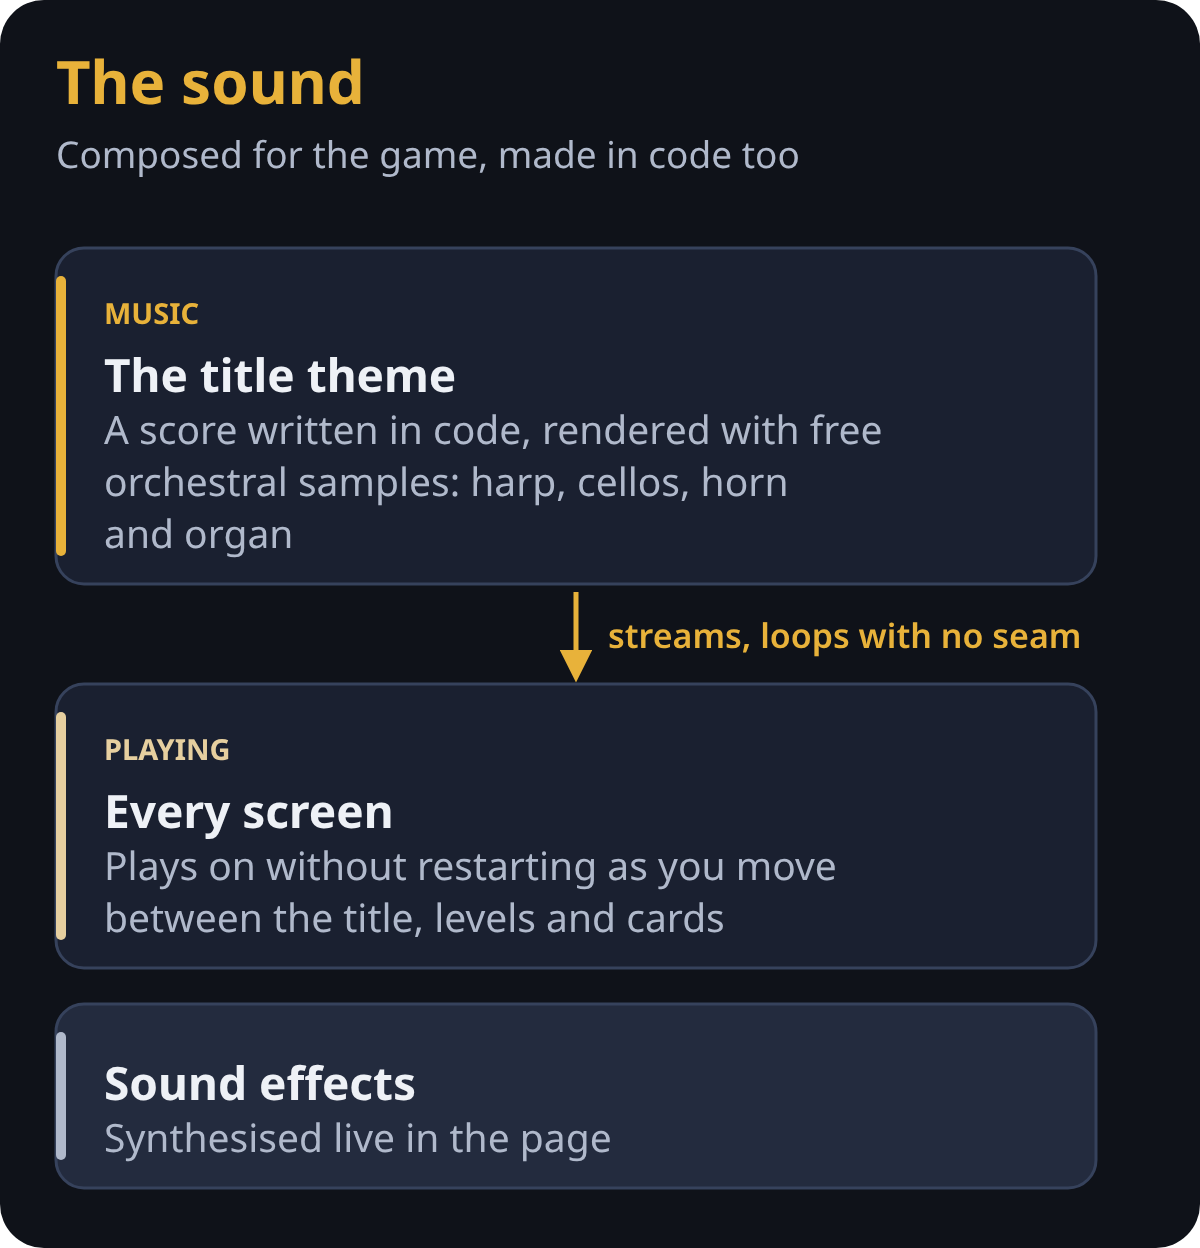
Even the music is made this way. The title theme was composed for the game as a score in code and rendered with free orchestral samples: harp, cellos, horn and organ. It streams rather than loading whole, loops with no audible seam, and plays on every screen without restarting; the sound effects are synthesised live in the page.
How the sound is made.
A solver at the heart of it
Every puzzle game has to answer one question: can this level be won? Crete has an exact solver built in. It searches every situation the level can reach (where Theseus and the Minotaur stand, what’s been picked up, which doors are open, where each hazard is) using A* search with a careful estimate of the moves left, and it packs each situation into a few numbers so it can hold millions of them. It proves a level winnable, finds its fewest moves, or proves it can’t be won.
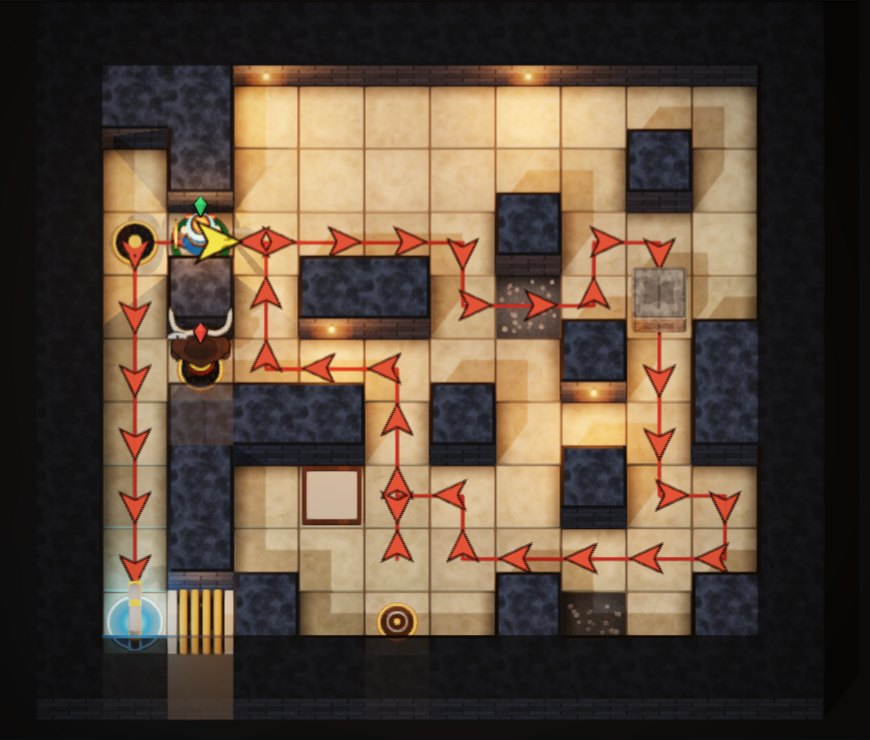
That solver powers everything players see: the “Best” move count on every level, Ariadne’s thread when you’re stuck, the editor’s Check button, and the Endless generator.
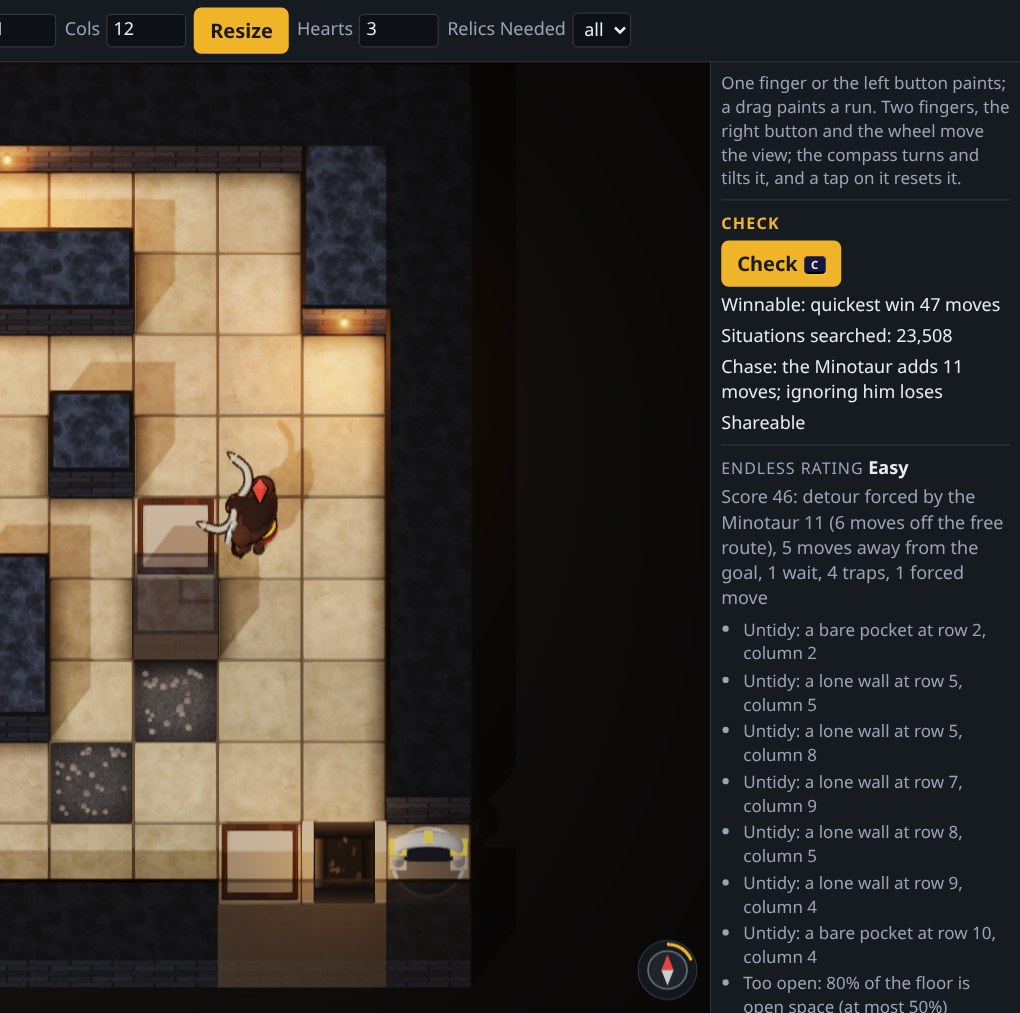
Ariadne's thread: the solver's shortest route.The editor's Check: fewest moves, rating, what to fix.
Rules every level must keep
Early on, a level could be winnable and still be no fun: the beast walled off from the start, or a door and key you could simply walk past. So every level, whether hand-made or generated, has to pass a gate:
The beast must matter. Ignoring the Minotaur and walking straight to the exit has to lose, and he has to stay a live threat for much of the route.
No forced catches. You never have to walk into him to win, because no player could know to do that.
Every piece has a purpose. Take any piece out, and the level must get longer, change, or become unwinnable. No decoys.
A steady climb. Each level is harder than the one before by a set margin. There are no cliffs.
Original layouts. No level is a rotated or mirrored copy of another; a test compares every pair.
Measuring "hard" the way people feel it
At first, “difficulty” meant how hard the solver had to work. Playtesting showed that’s not what people feel. In Endless, I could put the wooden cow down at once and simply walk past the beast. So we tested it. We wrote simple “habit” players: one that just walks, one that drops the cow on move one, one that raises the mirror whenever he’s close, a careful one that dodges, nine in all. About 29% of the Endless levels of the time fell to one of those habits, and the solver’s effort didn’t predict which.
That matches the research. Jarušek and Pelánek, studying thousands of human Sokoban solves, found that how much work a computer does to solve a puzzle explains little of how hard people find it. Robert Abbott’s notes on his Theseus and the Minotaur mazes say the same in plain words: what makes a maze hard is its false paths.
So no level at any setting can be beaten by a habit, and difficulty is scored by things people actually feel: how far the beast forces you off the best path, moves that look wrong but are right, waits, and traps that look safe but can’t be won.
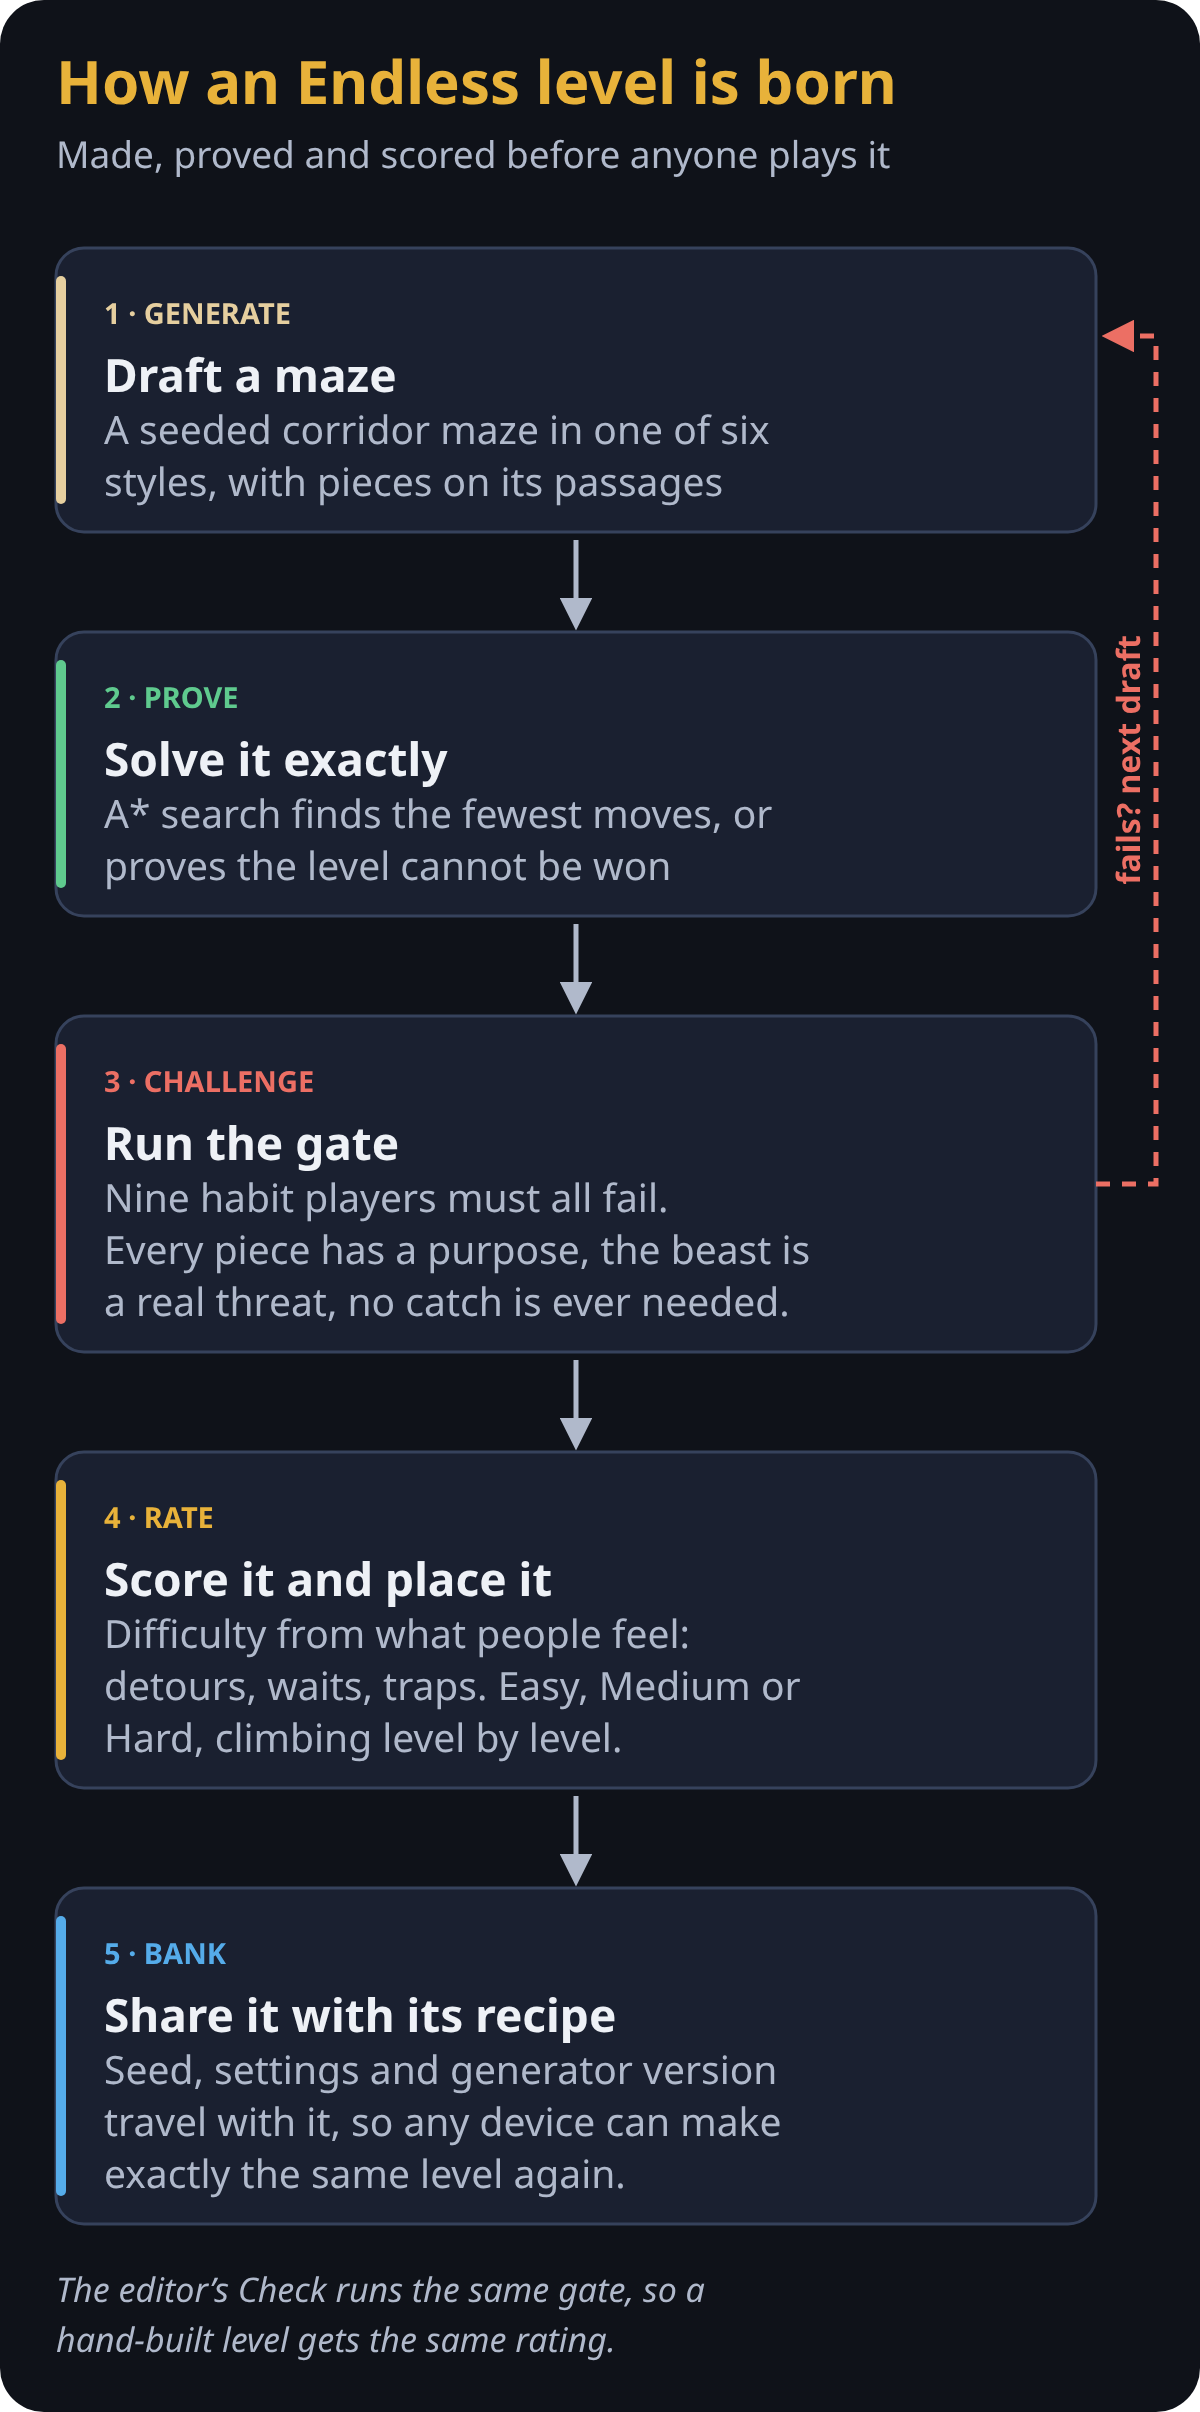
Every Endless level goes through the same five steps.
Levels by hand and by machine
The campaign’s levels are drawn by hand in the game’s own level editor, and the automated tests hold every one of them to the gate on every change. Endless is made by machine: a seeded generator carves corridor mazes in six different styles, places pieces on their passages, and keeps only the drafts that pass the gate. It comes in Easy, Medium and Hard, each climbing level by level to a plateau, and a run never shows you a maze that looks like one of your last twelve.
Anyone can build levels too. The editor’s Check runs the same solver and the same gate, shows the fewest moves and the Endless rating, and lists in plain words anything that keeps a level out of Endless. A finished level is shared as a link: the whole level travels inside the link itself, with the solver’s proof that it can be won.
A shared bank of levels
A good Endless level can take a couple of minutes to find on a phone. So the game keeps a shared bank: players who choose to help send up the levels their devices make, and every player can draw fresh levels from it at once. The hard part is trust: a person must never be able to sneak in a level drawn by hand, say a maze whose walls spell a word.
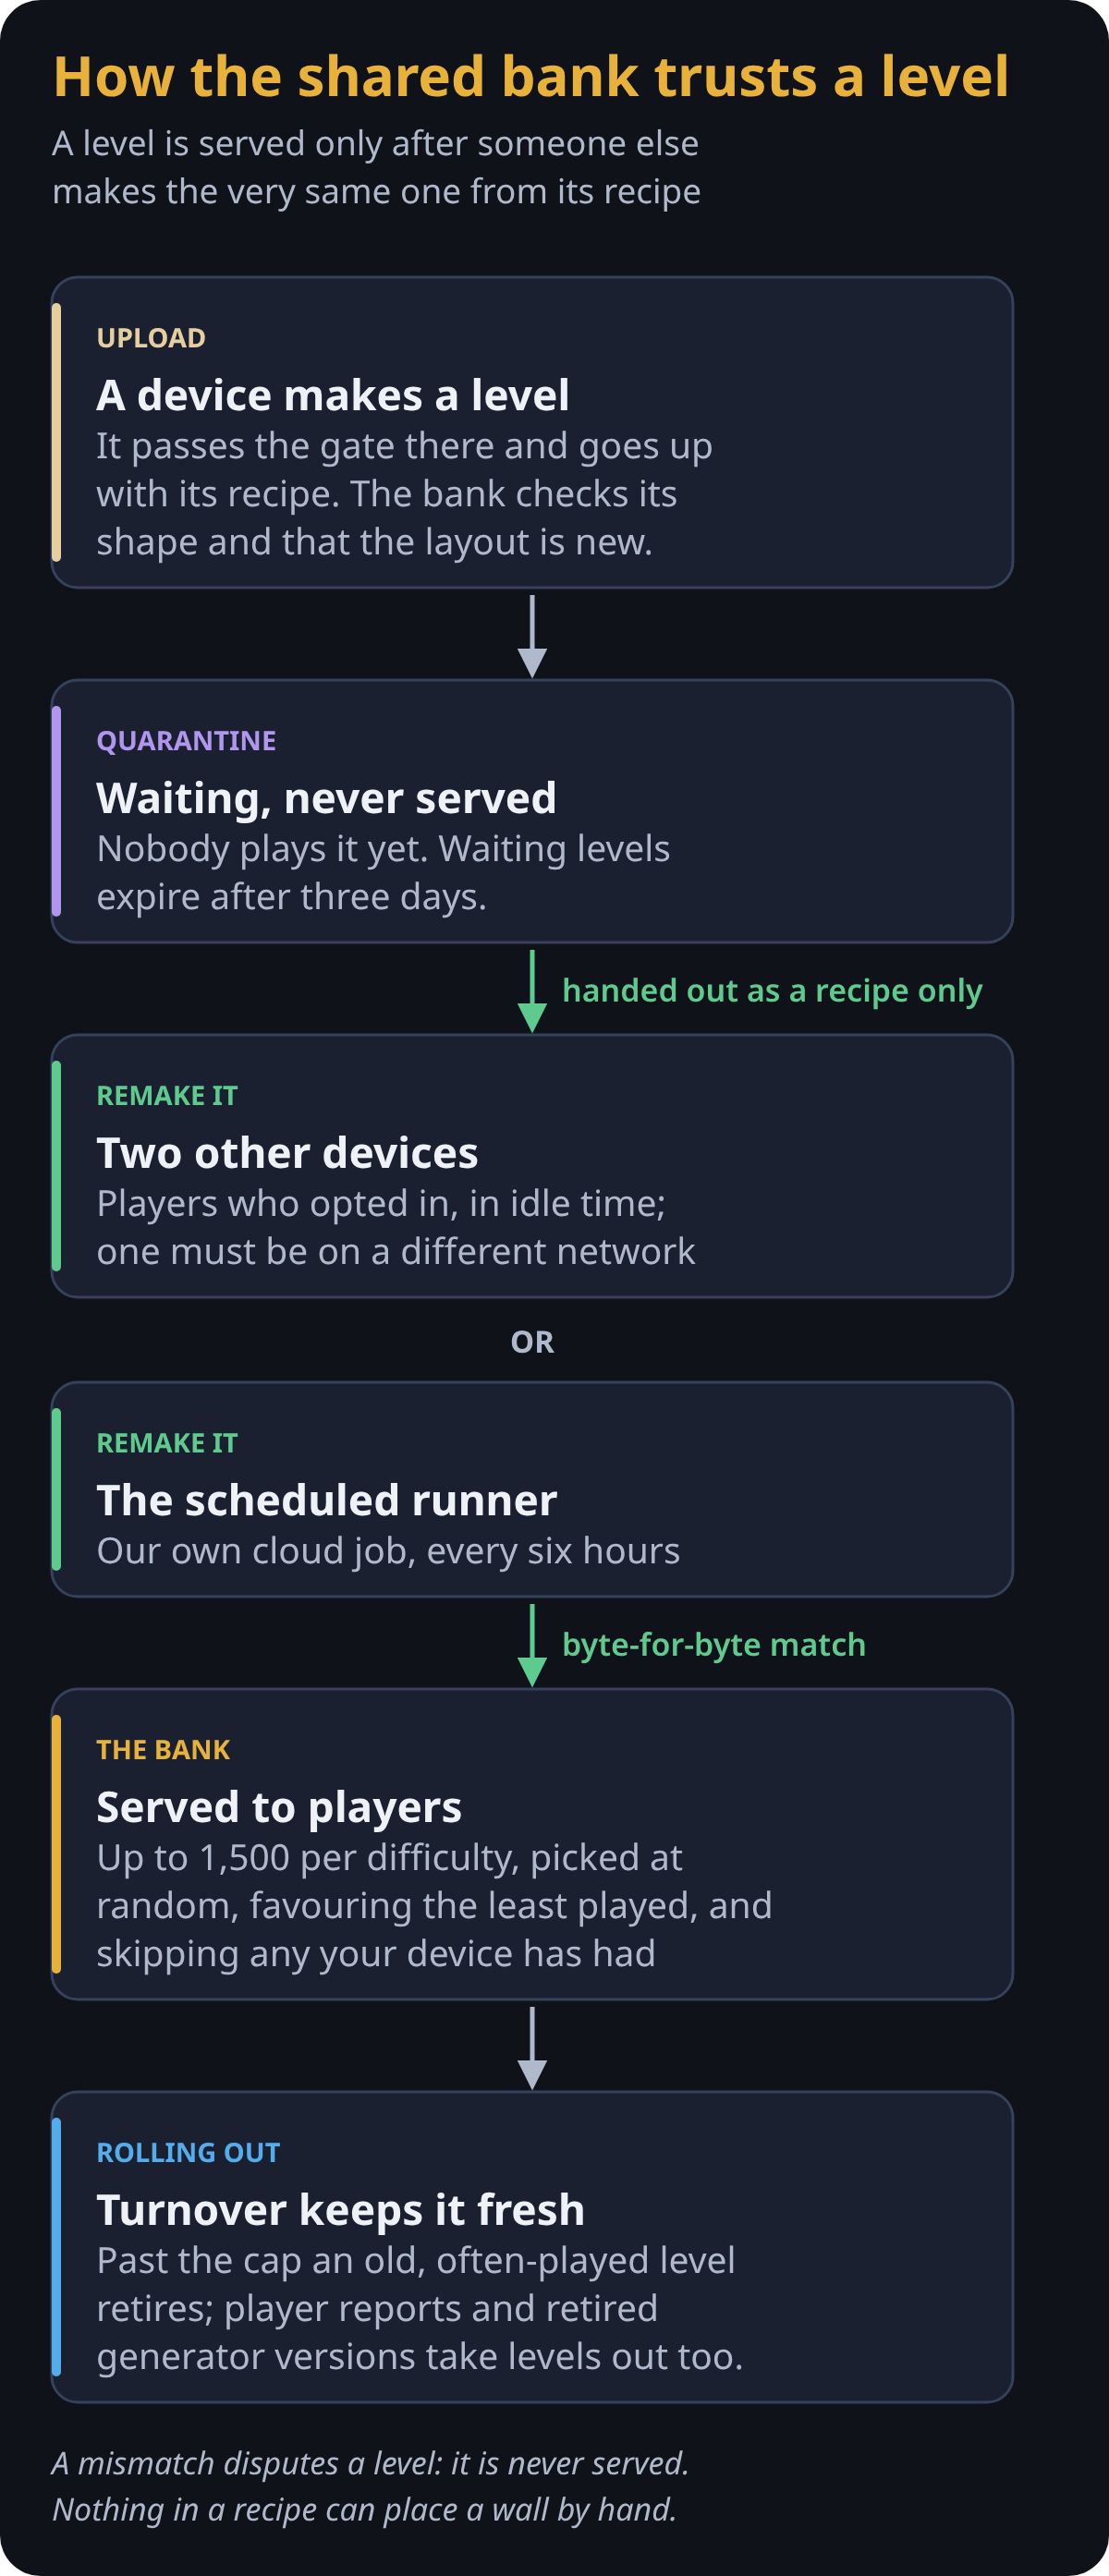
The answer is the recipe. Generation is deterministic, so each level carries the seed, settings and generator version that made it. A new level waits, unserved, until two other devices, one of them on a different network, are handed only the recipe and make exactly the same level, byte for byte. Nothing in a recipe can place a wall, so only levels the generator really made reach players. Only devices whose players said yes do this checking. The game asks once, the first time you start a new game or Endless, whether to Help Build Endless Levels; it stays off until you say yes, and you can change it any time in the menu. Even then it works only while the game sits idle, never during play or on a low battery.
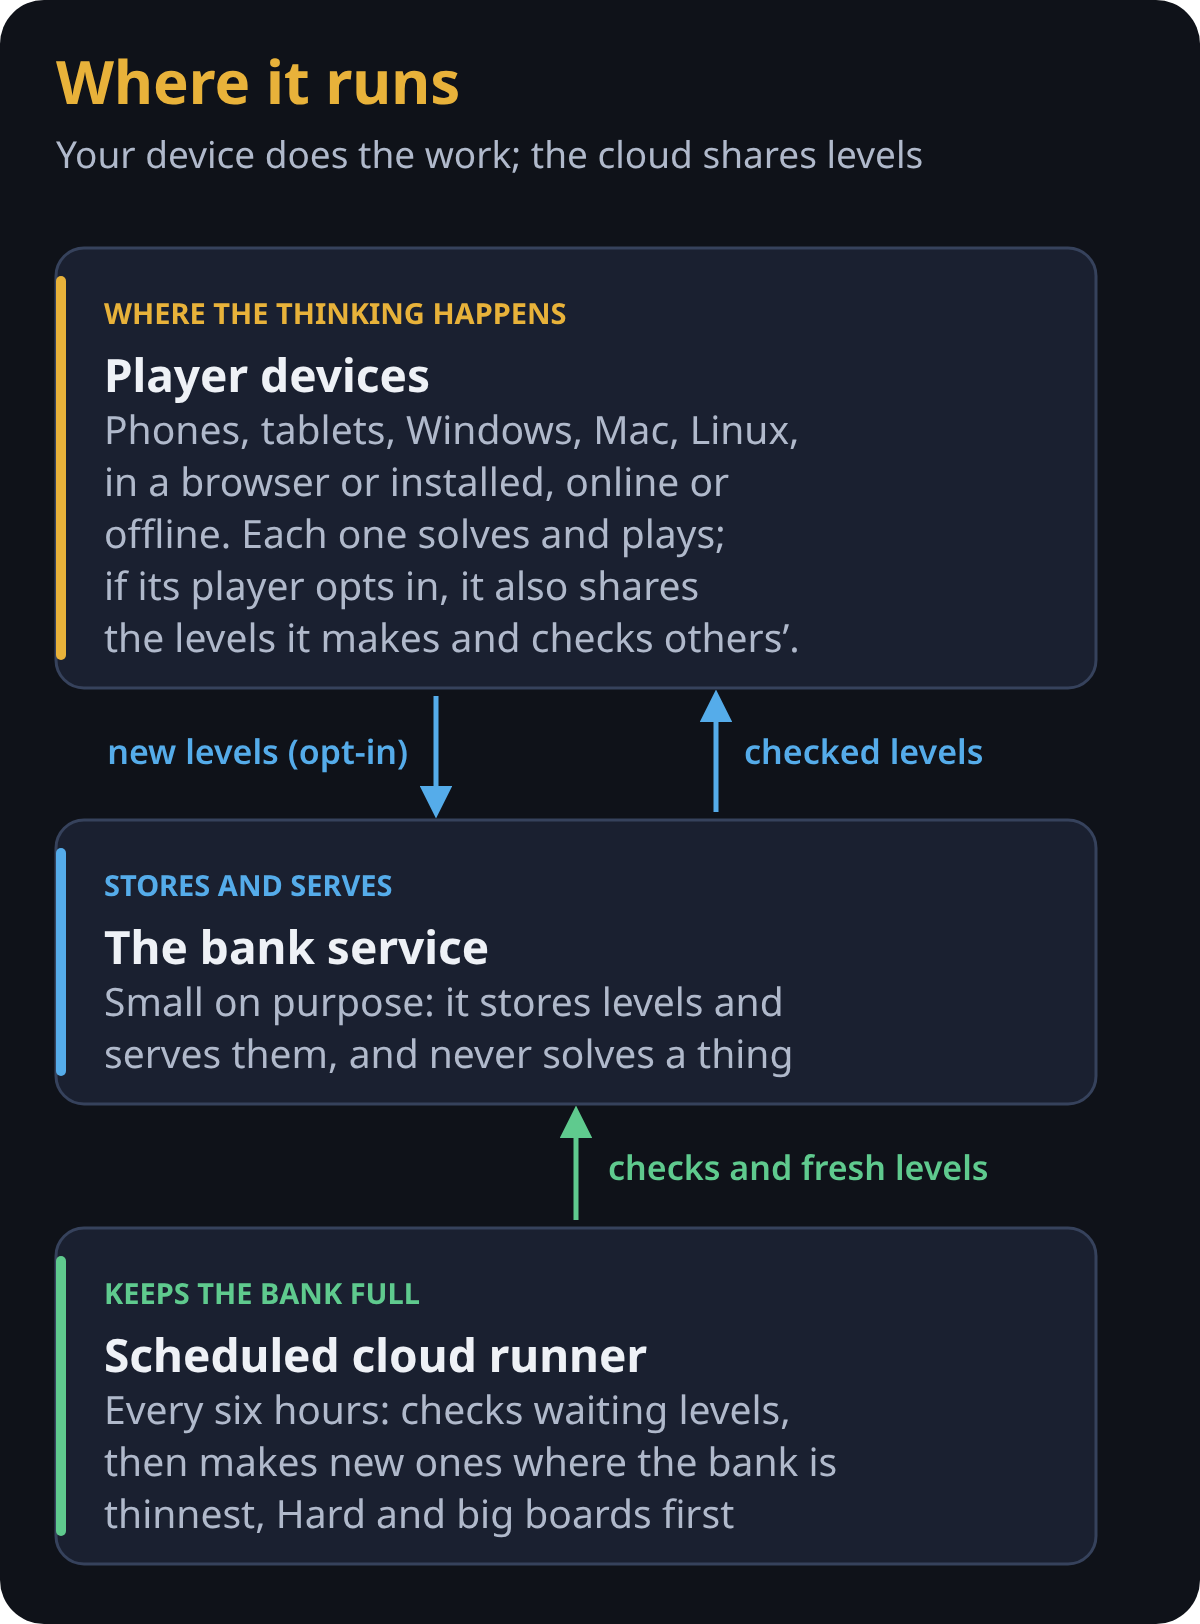
With few players, a scheduled cloud runner of ours keeps things moving: every six hours it checks the levels waiting in line, then makes new ones where the bank is thinnest, Hard and big boards first. The bank service itself is small on purpose: it only stores and serves levels; all the solving happens on players’ devices and the runner.
Inside the level bank
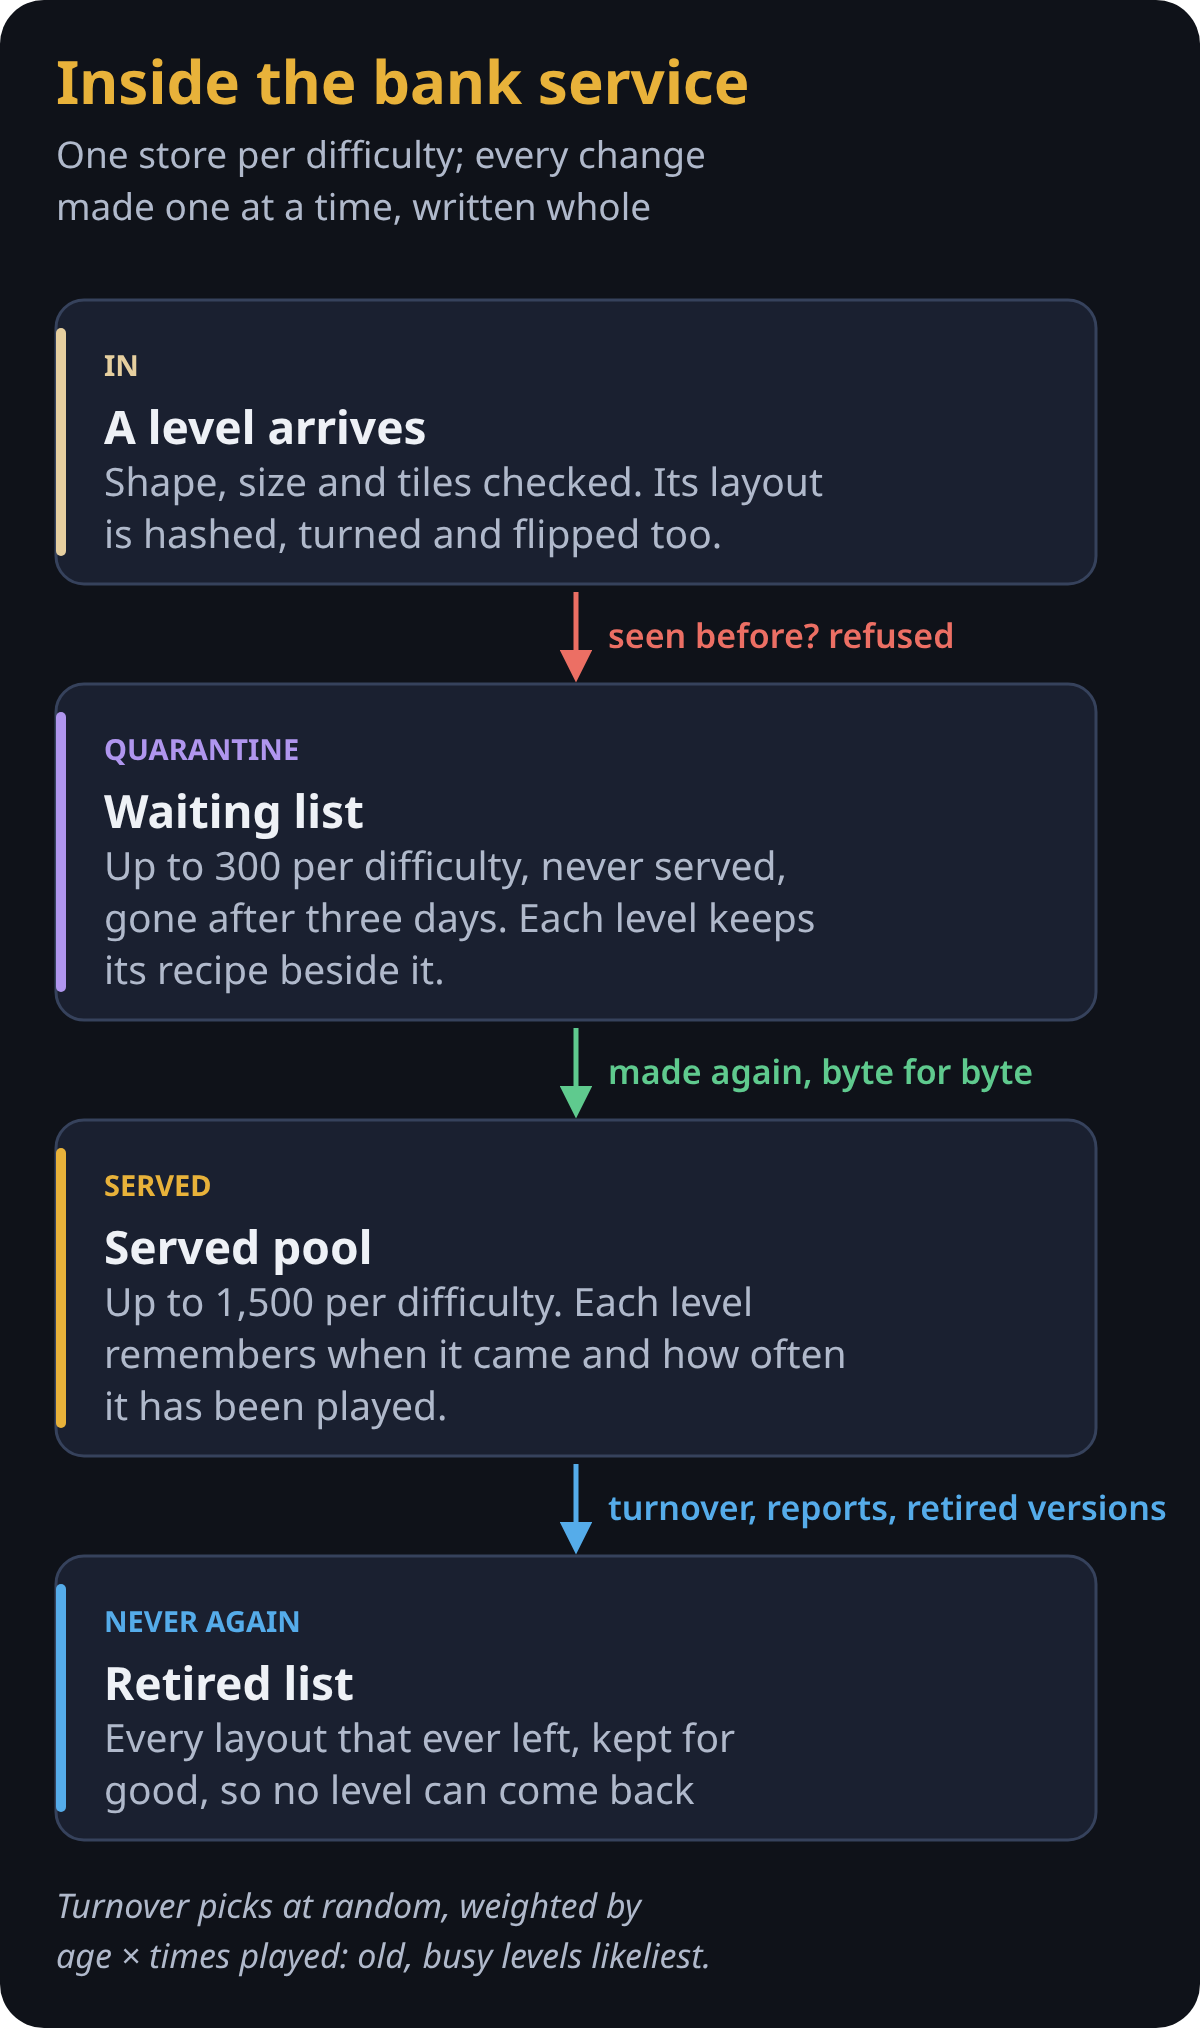
The bank service keeps one store per difficulty, and every change to a store happens one at a time, under a lock: the new copy is written in full beside the old one, then swapped in, so nothing ever reads half a file. Each store has two parts. The waiting list holds up to 300 levels that no player is served, each kept with its recipe, and drops any still waiting after three days. The served pool holds up to 1,500.
Every arriving level is fingerprinted by its layout, turned and flipped too, so a copy is refused at the door and takes no room. When a new level takes a difficulty past its cap, one served level retires, picked at random but weighted by its age and how often it has been played, so the bank turns over steadily without losing its oldest levels all at once. Two reports from players on different networks retire a level too, and when the generator changes, a whole old version can be retired. Every layout that leaves goes on a retired list that is kept for good, so no level ever comes back.
How the bank trusts a level.What the bank keeps.
Making levels at scale
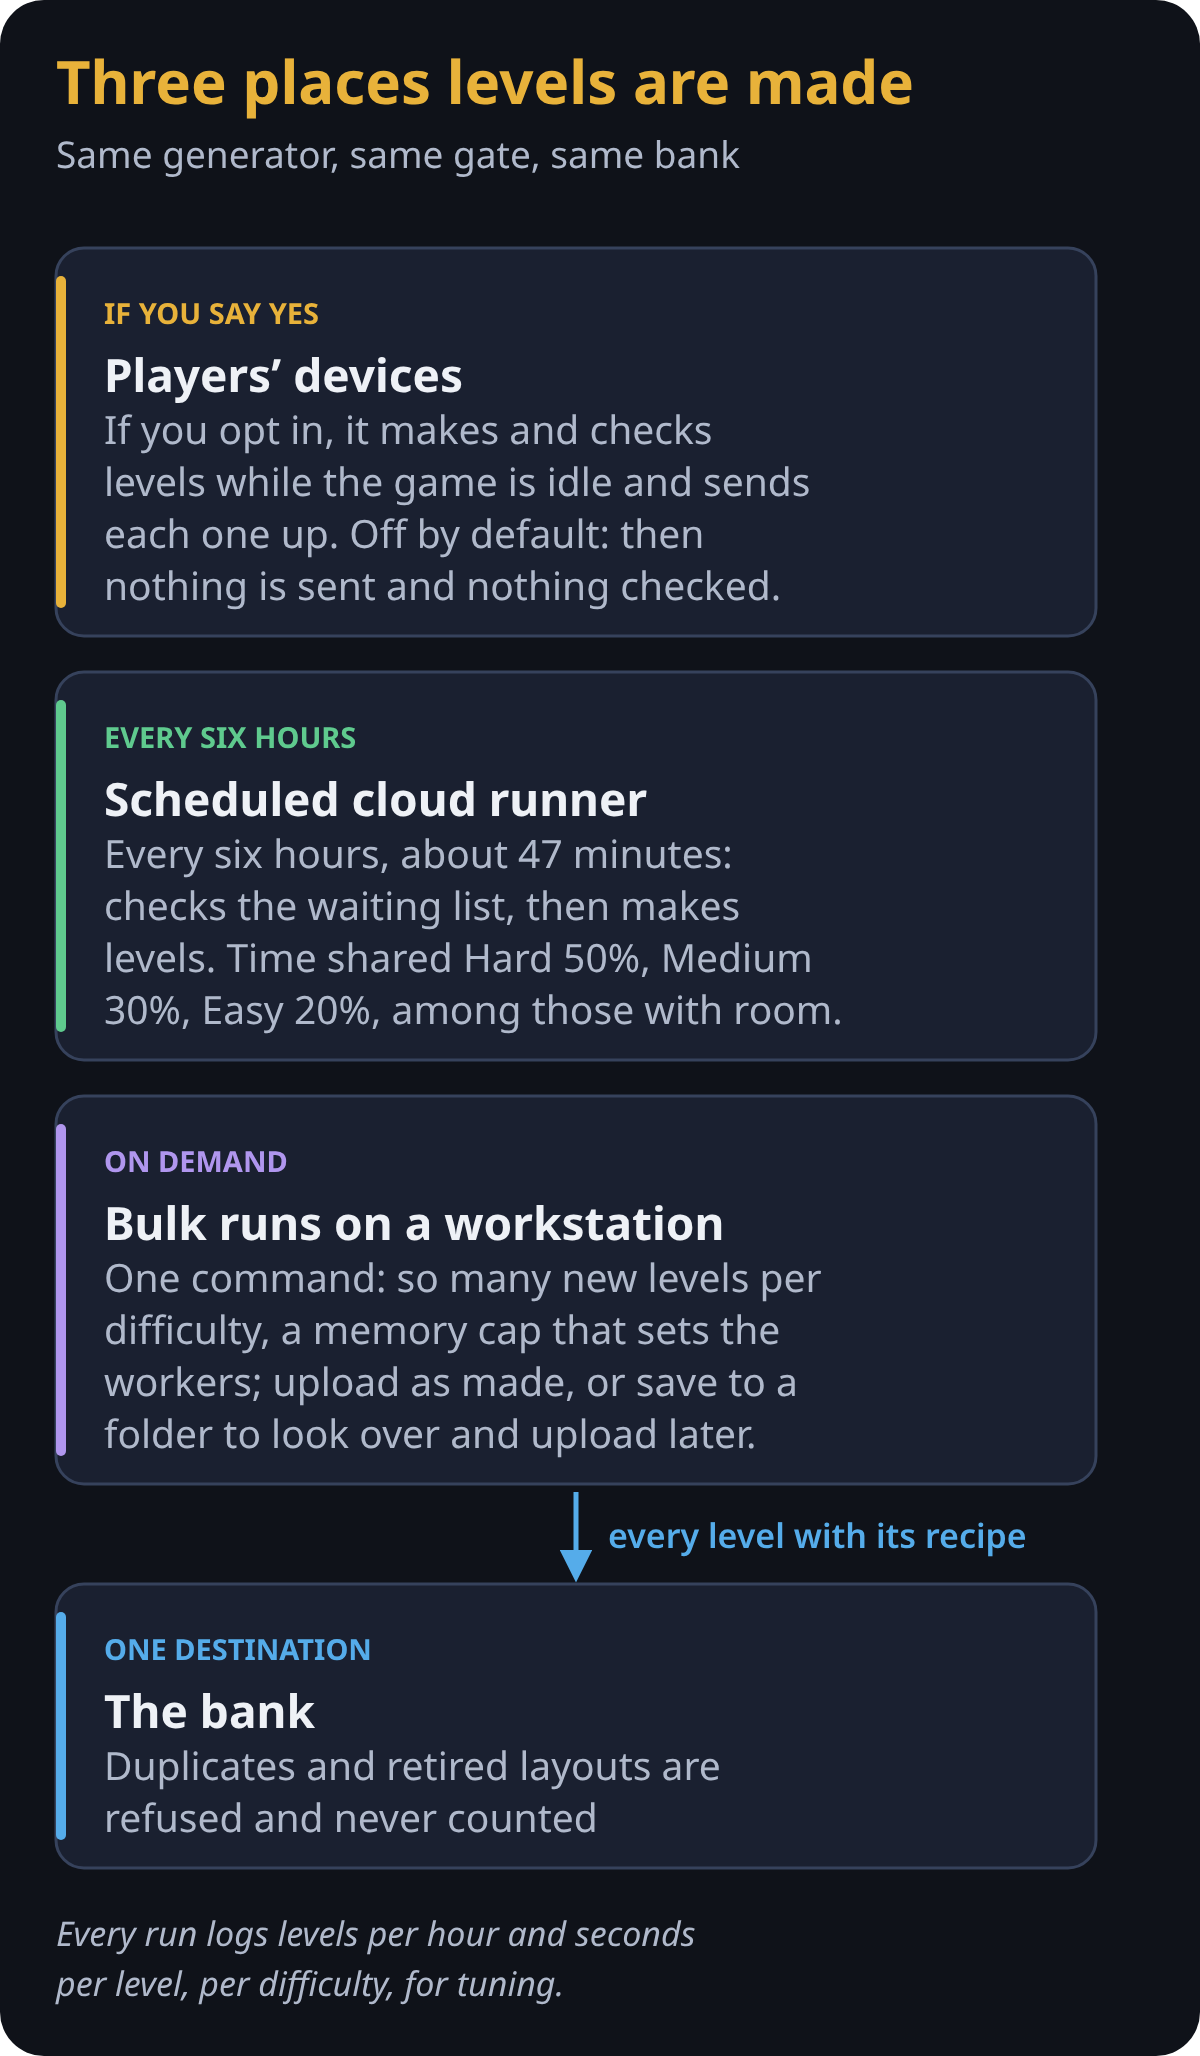
Levels come from three places, all running the same generator and the same gate. On a player’s device it’s opt-in: with Help Build Endless Levels on, a background worker makes and checks levels while the game sits idle, never during play or on a low battery, and sends up each level it makes. With it off, the default, the device sends nothing and checks nothing; it plays levels from the bank first and makes its own only when the bank has none that fits. Either way it keeps up to 150 of its own levels, so it always has something to play offline. The scheduled cloud runner works for about 47 minutes every six hours: it checks the waiting list first, then spends the rest making levels, sharing its time Hard 50%, Medium 30% and Easy 20% among the difficulties with room, and making whatever kind each is shortest of, such as big boards. For a big fill, one command on a workstation makes a set number of new levels per difficulty, under a memory cap that decides how many workers run. It either posts each level as it’s made, or saves them to a folder to look over and upload later.
Duplicates and retired layouts are skipped and never counted; another level is made in their place. Every run ends with its numbers, levels per hour and seconds per level for each difficulty, so we can see where the time goes and tune it.
Three places levels are made.Where the work happens.
How a level reaches you
Most players get their levels from the bank. Your device keeps a small cache for each difficulty, up to 40 levels, and tops it up when it runs low. Anyone can send levels to the bank, so the device takes none on trust: before playing one, it replays the level’s stored winning line on its own engine and runs the gate’s quick checks, a moment’s work rather than a full search. A level that fails is skipped (and, if you help build levels, reported). With no connection, or nothing that fits, it plays one of its own or makes a new one.
How changes reach players
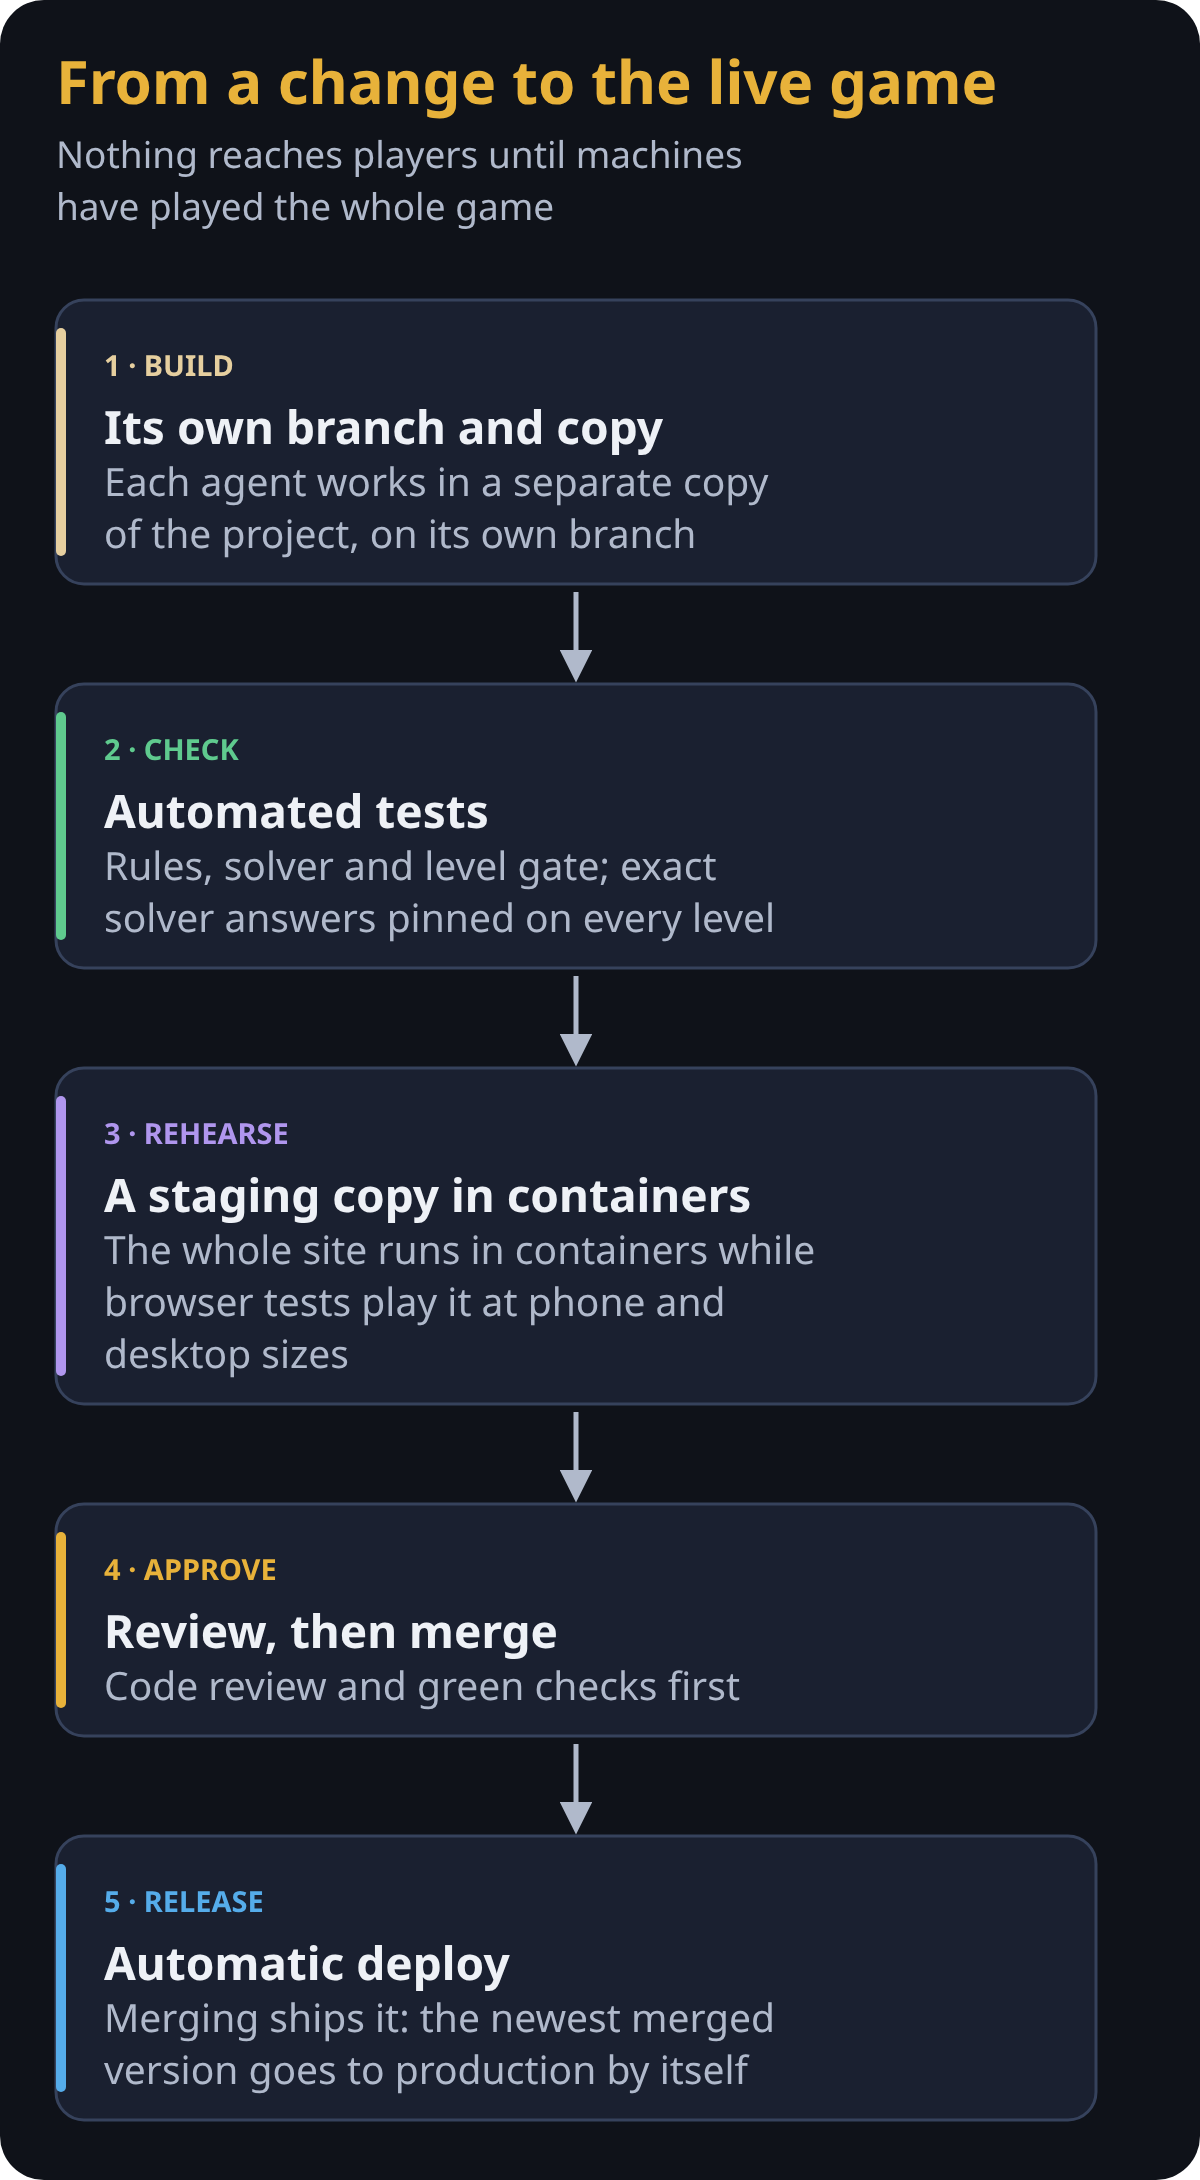
More than a thousand automated tests run on every change: the rules, the solver, the generator, the share links and the bank. Some pin the solver’s exact answers on all 100 campaign levels and every level in the built-in Endless banks, bit for bit, so a change meant only to make the solver faster can’t quietly change a single answer.
Before anything ships, the whole site runs as a staging copy in containers, and browser tests play the game on phone and desktop screen sizes, in both looks. Only then is a change reviewed and merged, and merging deploys it to production automatically.
The layers of checks.From a change to the live game.
Small decisions that added up
Retracing is undo. If you step back to exactly where you were, with nothing else changed, those moves are taken back, so you’re not punished for exploring.
Hidden walls are fair. A fake wall opens as you walk through it. An invisible wall shows a faint pane of glass while you stand beside it, and bumping it reveals it for a turn. Levels with hidden walls are tuned a little easier, because the player can’t see what the solver knows.
Quiet by design. No pop-ups mid-move; the first time you meet a piece you get one card, after that just a brief banner. This game is about subtlety and a lack of distractions.
Phones first. Most of my testing was on a phone. The move pad, the camera gestures and the layout were all reworked from real play on a small screen.
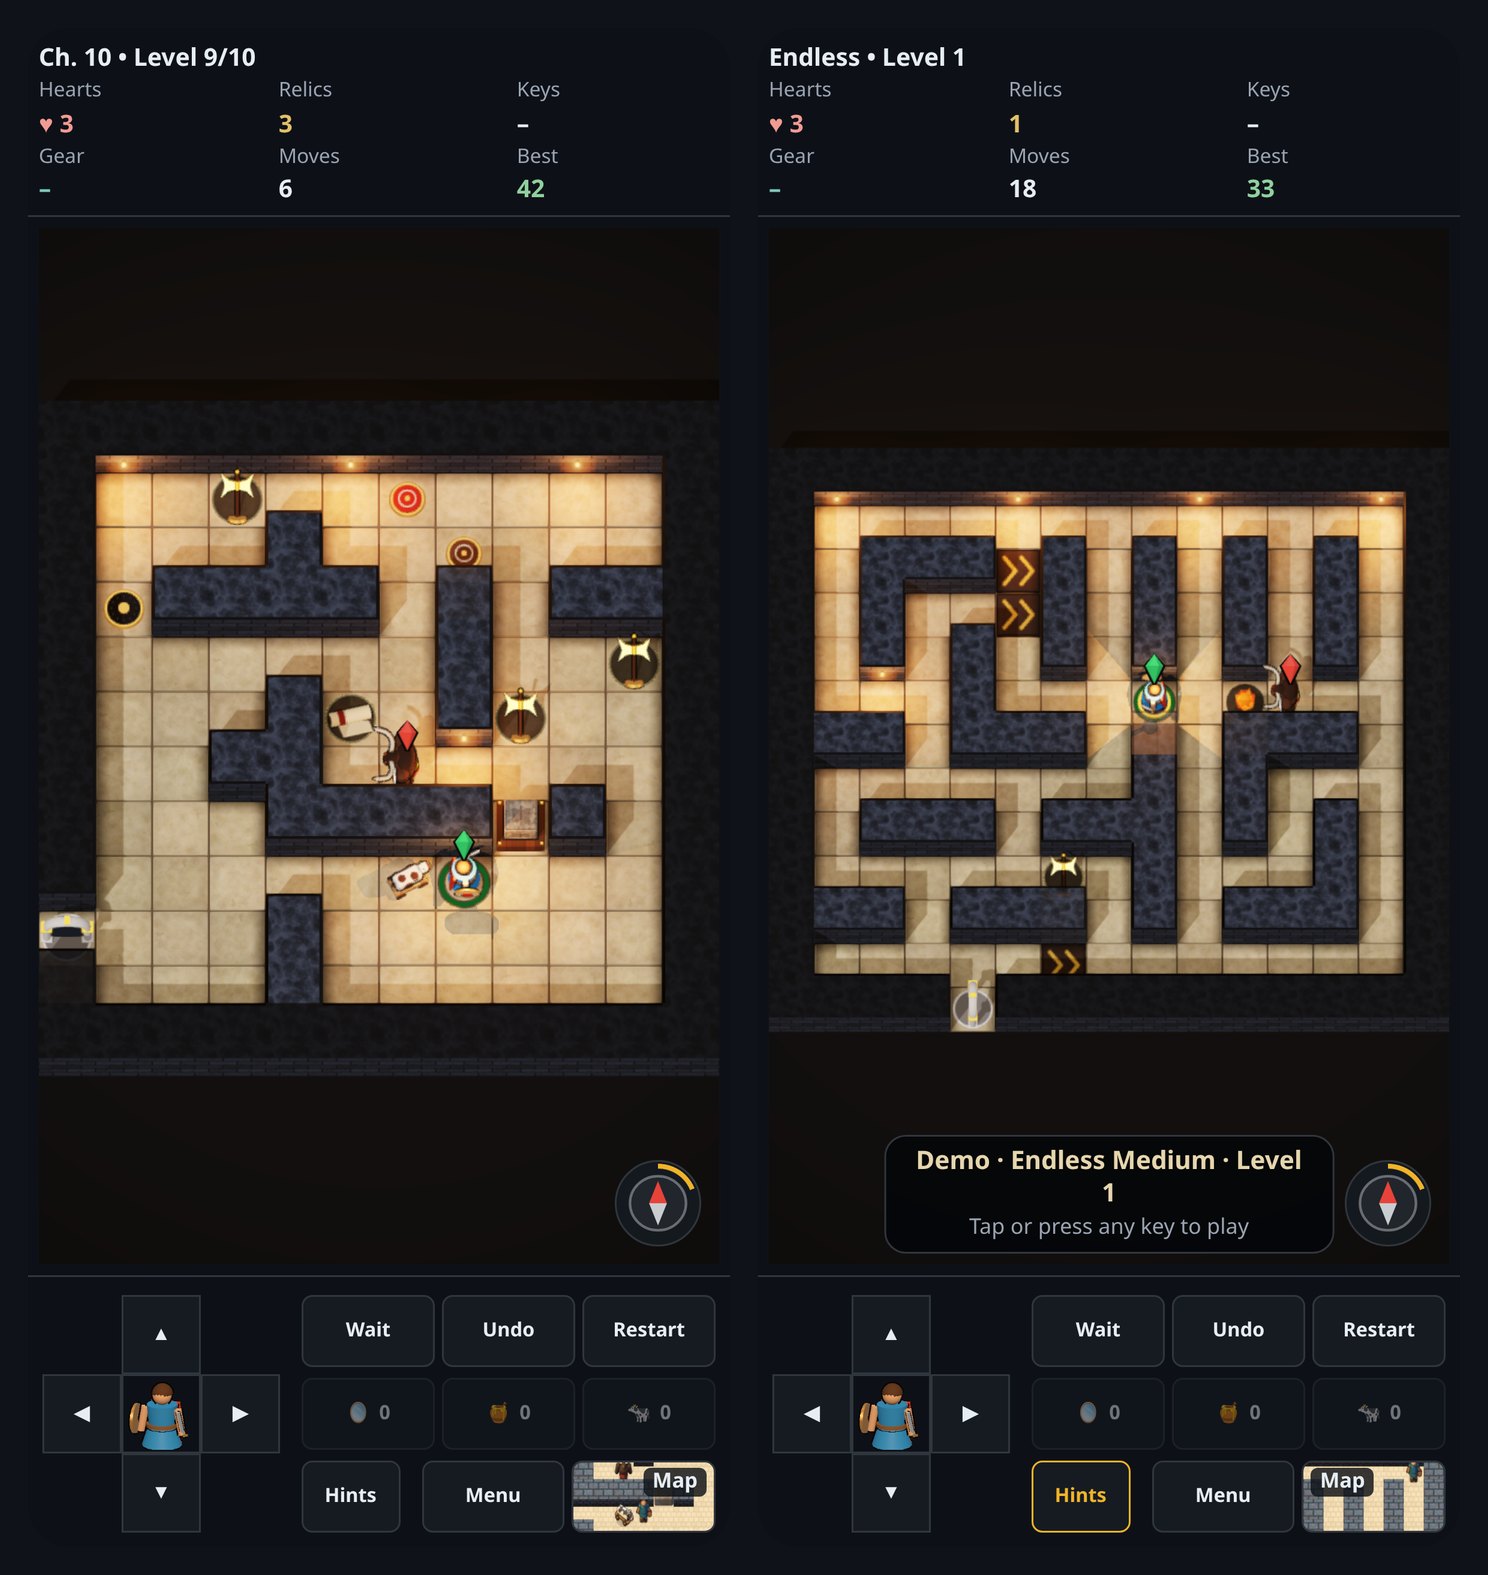
The result runs on phones, tablets, Windows, Mac and Linux, in the browser or installed like an app, online or off.
On a phone: a campaign level, and Demo playing Endless by itself.
Operation Tankity is artillery in the spirit of the classic Scorched Earth games. Your tank rolls out onto rolling hills against a battery of drones. Set your angle and power, mind the wind, and fire. Every round gets harder, and between rounds you spend your winnings in the shop on bigger guns, armor and parachutes.
The drones aren’t pushovers. Each one has its own personality: a gambler, a saver, a spotter. They earn and spend money just like you do, and they aim with real physics. Shots arc through the wind, blast the ground away, and anything left hanging over a crater falls.
Play with friends
Play solo, or press Play with Friends to open a room and send the link. Up to ten players can share a battle, each taking turns from their own phone or laptop. Long games are supported too: the host can give each turn anywhere from a minute to a week.
How to play
New to it? Press Tutorial. It walks you through the shop and your first shots on the live battlefield.
Aim: the arrow buttons or keys change the barrel’s angle and the shot’s power.
Drive: move your tank left and right, but driving burns fuel.
Fire: the big red button, or the space bar.
Initials: pick three letters. They follow you onto the scoreboard and into rooms.
Want something like this built for you, or a website, AI or machine learning work? Get in touch with Happy STL.
Last night, I spent several hours conversing with Perplexity AI in this session to understand various quantum phenomena better, including the math and general concepts behind: Quantum Tunneling, Quantum Annealing, and Quantum Energy Teleportation.
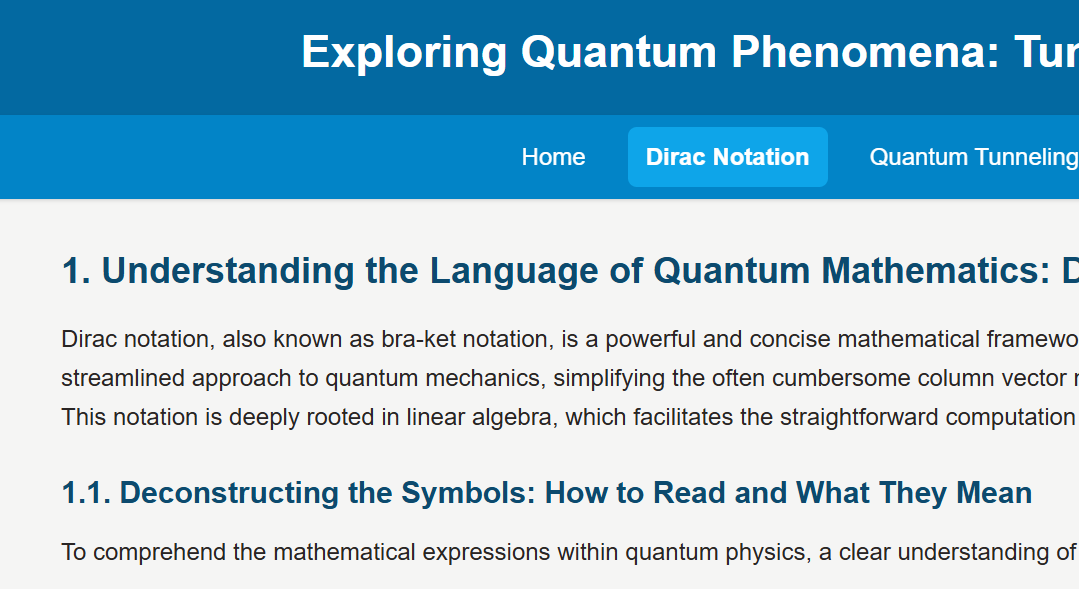
As a result of my work, I then took it to Gemini Deep Research to have it organize everything better than my sporadic, adhoc style of research had been. The result of that work is available on this site by clicking the image above.
The hope is that you can start with this research and start your own journey towards understanding quantum mechanics and how they can be used to break down geometrically complex problem spaces that cannot be solved by classical means into much smaller problem spaces that can be solved in reasonable amounts of time.
In the last portion of our three-part series, we will be reviewing some of the code behind the Simple Moving Average (SMA) and Exponential Moving Average (EMA) predictive indicators that we have developed. Specifically, we will spend a little bit of time looking at the EMA Projection and the EMA Projection Trend indicators, since these have seemed to be the most useful ones thus far.
Before we get into it, I would like to introduce you to the Huddle, a place where we can crowd around, look at quantitative analytics code, and share ideas. Think of it as a community of ideas and concrete code in a format that is a bit less formal than a traditional code repository might be.
EMA Projection
First up, we have the EMA Projection, which is just our standard EMA plus a projection of where it should land at the current T0. It can make that projection two ways. The first, AverageSlope, takes the gross slope of our line as
m = dx / dy
dx = EMA_at_T_minus_1 - EMA_at_T_minus_period_minus_1
dy = Period  # T-1 back to T-(Period+1) spans
             # exactly Period bars
The second, PriceHold, is the default. It asks a simpler question: where would the EMA land if this bar closed exactly where the last one did? Thanks to how the EMA is built, that works out to the last bar’s slope, scaled down a little:
k = 2 / (Period + 1)  # the EMA's own weight
m = (1 - k) * (EMA_at_T_minus_1 - EMA_at_T_minus_2)
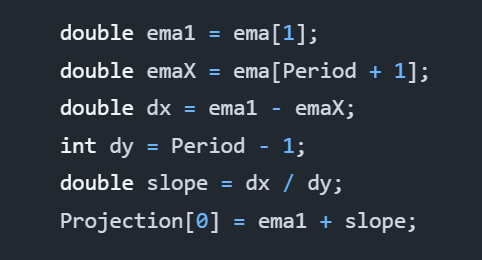
Specifically, the code that matters looks more like this in the real deal:
int lookback = ProjectionMethod == EMAProjectionMethod.AverageSlope ? Period + 1 : 2;
if (CurrentBar < lookback) {
	return;
}

double ema1 = ema[1];
double slope;
if (ProjectionMethod == EMAProjectionMethod.AverageSlope) {
	// ema[1] back to ema[Period + 1] spans Period bars.
	double emaX = ema[Period + 1];
	slope = (ema1 - emaX) / Period;
} else {
	// PriceHold: if this bar closes where the last one did, the EMA moves by
	// k * (Input[1] - ema1), which by the EMA's recursion is (1 - k) * (ema1 - ema2).
	double k = 2.0 / (1 + Period);
	double ema2 = ema[2];
	slope = (1 - k) * (ema1 - ema2);
}
Projection[0] = ema1 + slope;
Specifically, ema is an EMA object that calculates our exponential moving average for us already. We do not have to perform all of that work again.
Period is a property that is passed into the object at runtime, and Projection is a time-series plot added to the object at runtime. By default, Period is 14.
As you can see, there’s nothing complicated about this code. The entire algorithm is really only a couple lines if you were to “golf” that code, but let’s leave it as it is for readability.
The AverageSlope method calculates the gross slope of the line over the last Period bars. We backtested it on ES futures and SPY against faster estimates, and that average lags: it pointed the wrong way on roughly 30% of bars and took a median of three to four bars to follow a turn. PriceHold had about half its error, which is why it is now the default. AverageSlope is still there if you want to compare the two.
EMA Projection Trend
Building on the code from the EMA Projection, we have the EMA Projection Trend. It is a simple extension to the EMA Projection, but it provides a much clearer view of momentum. Specifically, it shows the changes in the slope of our EMA Projection as a proxy of momentum, which is a proxy of volatility, where larger bars indicate more change in the trend.
Altogether, this indicator seems to respond well to trend changes and can let us catch rides after it confirms other leading indicators. At least I have enjoyed using it.
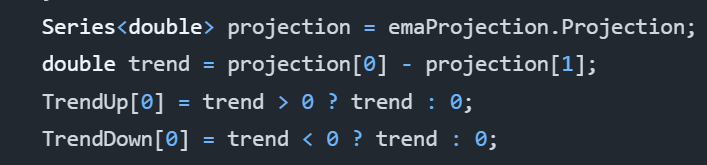
Without further delay, here is the entire algorithm:
As one can tell, it uses our EMA Projection. It performs a simple comparison of the T0 projection to the most recent prior projection at T-1. This shows us the trend and lets us see the momentum of our projection as it progresses.
The reason for TrendUp and TrendDown calculations being separate is because they are actually two different time-series plots. This allows us to choose distinct colors and is how we can show both green and red bars efficiently.
That’s All!
And with that, that’s all we have for today. This series is really supposed to be a three-part series, but having written what I have, I believe there is the possibility of some more talk on using moving averages as leading indicators.
Update, November 2026: we published a fix to the EMA Projection indicator. Its slope divided the change over Period bars by Period - 1, overstating it, and a backtest showed that averaged slope lagging, so the projection now defaults to PriceHold. The code above is the corrected version; see the fix on GitHub for the original and the backtest.
In the first part of our story, we discussed the Simple Moving Average (SMA) Projection line that showcased the SMA and a projection of the SMA in the next time step. From this, we could determine a little bit about volatility and also where the projections look like the current price action should be going.
I concluded my analysis of the SMA Projection as saying that I would not rely on it, but I think that I had spoken too soon. I performed more research on the idea and came up with another concept called the SMA Projection Trend, which is the same data, except it is instead represented as the difference between the current T0 projection and the most recent T-1 projection.
However, this will not be about the SMA Projection and SMA Projection Trend indicators. Instead, I have found more utility in the EMA Projection and Exponential Moving Average (EMA) Projection Trend indicators. The EMA is more responsive to immediate events and exponentially decays the more historic data to give a an average that is more biased towards recent data, which is important for traders that care about current price action.
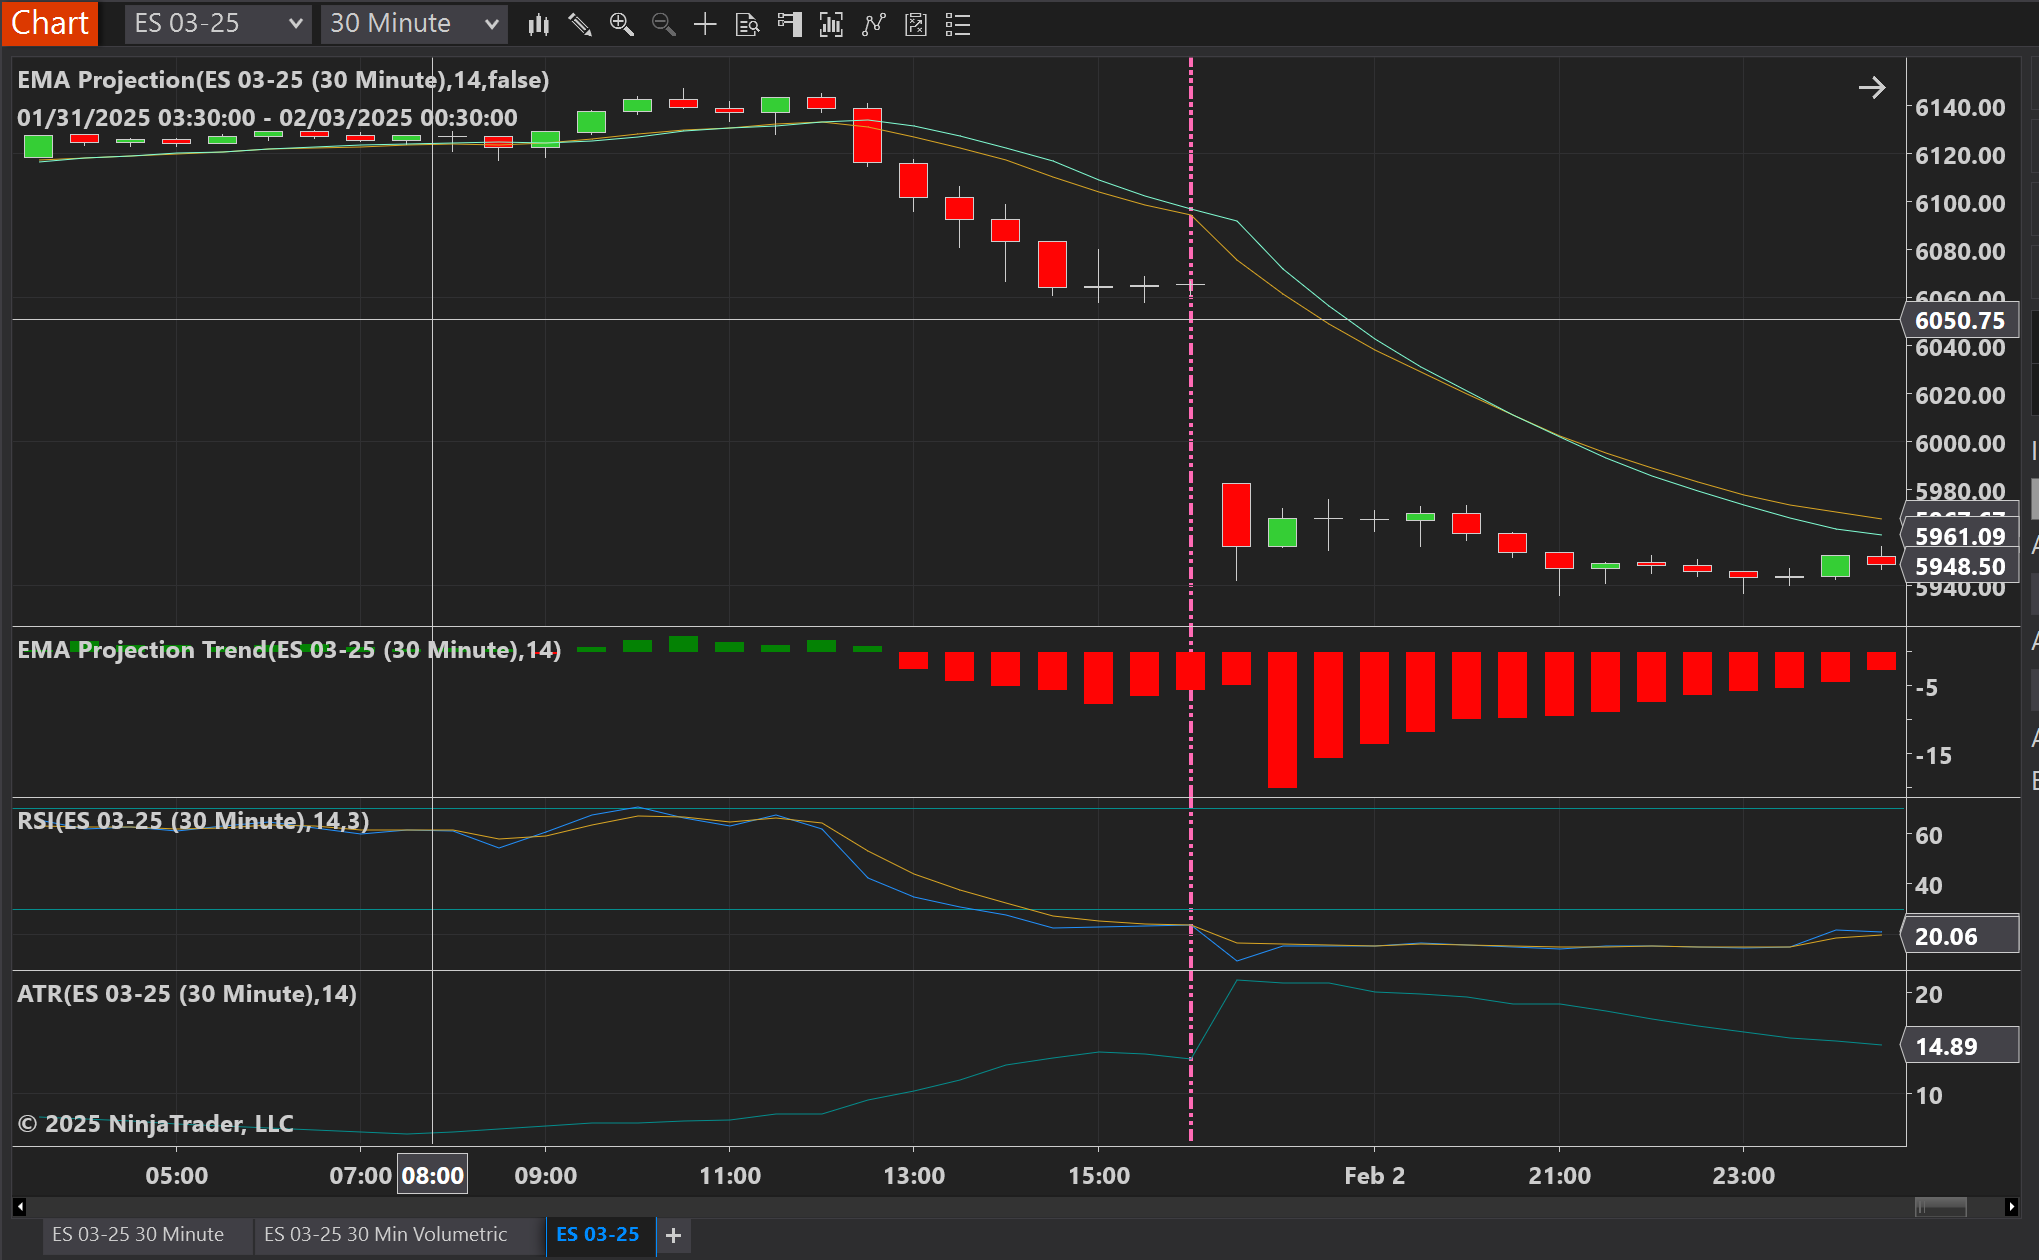
Whether talking about the SMA or EMA Projection Trends, they both measure momentum, which also takes into account volatility. For example, looking at the next chart, you can see captured momentum soon after the RSI crossed into overbought territory.
ES 30 minute chart with the EMA Projection overlaying the live data and the EMA Projection Trend displaying momentum in the graph beneath that.
To get a clearer picture, I have zoomed into the area of interest. For a 30 minute period, the RSI crossed into overbought territory before returning to normal. That was our first signal that we should begin paying attention for a good entrance, but we did not receive confirmation until three hours later that momentum was finally beginning to move downward.
Patience is key. The more confirmation signals you have, the more reliable your entrance.
RSI became overbought, and a few hours later, we receive our first indication that momentum is beginning to move in the expected downward direction.
In my opinion, we would have actually entered a short position three and a half hours after the RSI overbought signal, because we would have wanted to confirm that the close of the first downward momentum bar we saw actually closed down. Remember, patience is key, and before entering any position based on technical or fundamental data, acquiring a lot of confirming signals adds fuel to the fire for your entrance.
This is the time I would have recommended entering. It is right after we close on the first downtrend momentum bar after we had earlier seen the overbought signal on the RSI.
Use a critical eye. Nothing is guaranteed.
Combined with some other indicators, such as the ATR, RSI and perhaps the Bollinger bands if it suits you, the Projection Trend seems to be a pretty reliable detector. As a word of caution, however, you must look at the charts and these indicators with a critical eye, because unforeseen events can occur that lead them to lie to you. Therefore, always ensure you are paying attention to as much general information as you can.
To aid in preventing these pitfalls of unforeseen challenges, I recommend setting appropriate trailing stops. You can choose these to suit your own risk levels, but I would think the ATR can help you do this by looking at the total level of volatility over the last several bars of information. Perhaps you would want to do 2x ATR, or perhaps you would want to calculate the volatility through the Black-Scholes equation and use that to determine potential price movements. However you do it is an exercise left to the reader, but these are just some ideas.
Come back again as one more part to this series will be released that links to Happiness Enterprises’ github repo with these models in it. If you have Ninja Trader 8, you will be able to use them directly, and if not, well, you can at least translate the code to your own platform of choice.
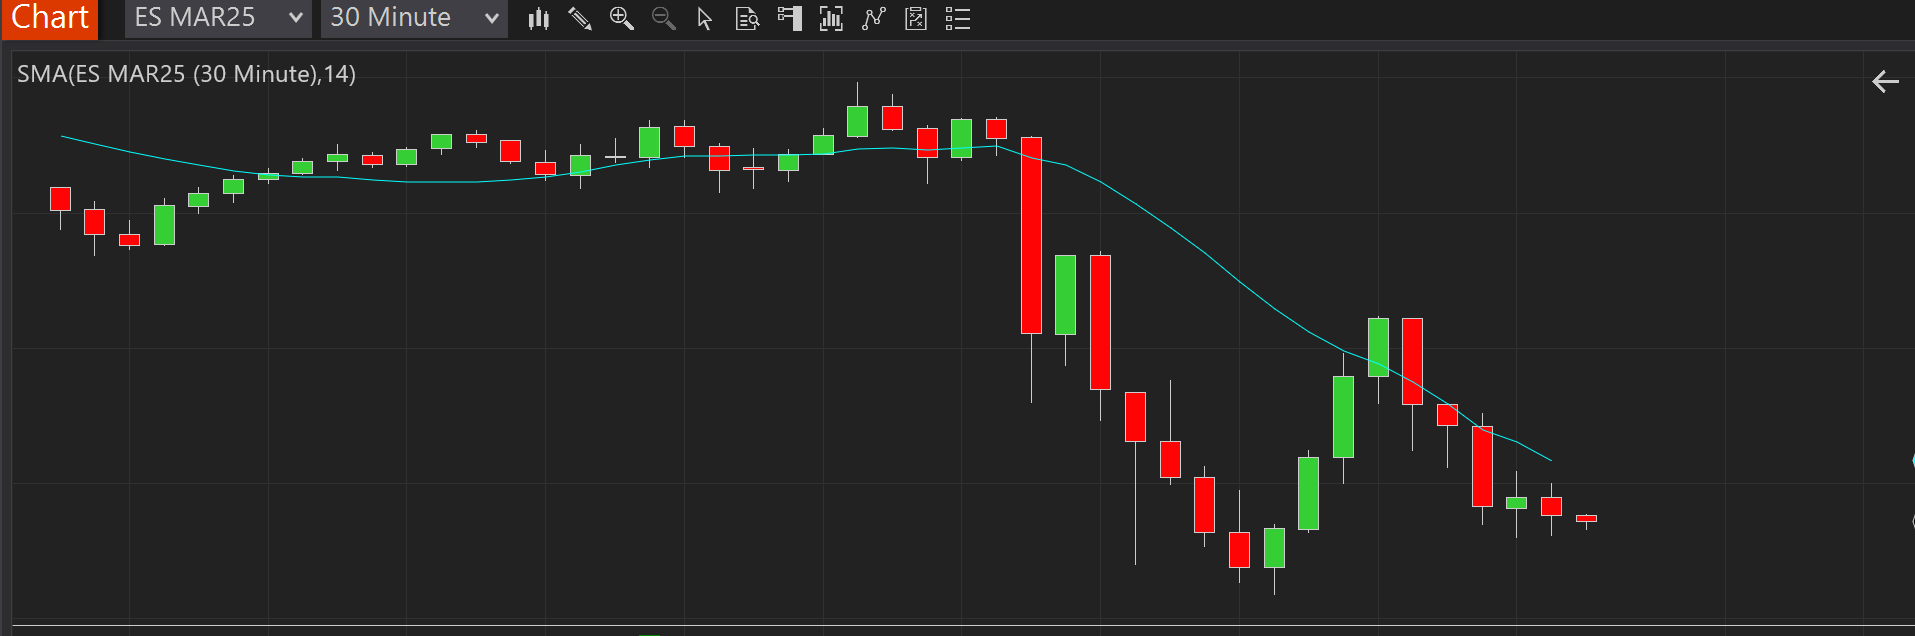
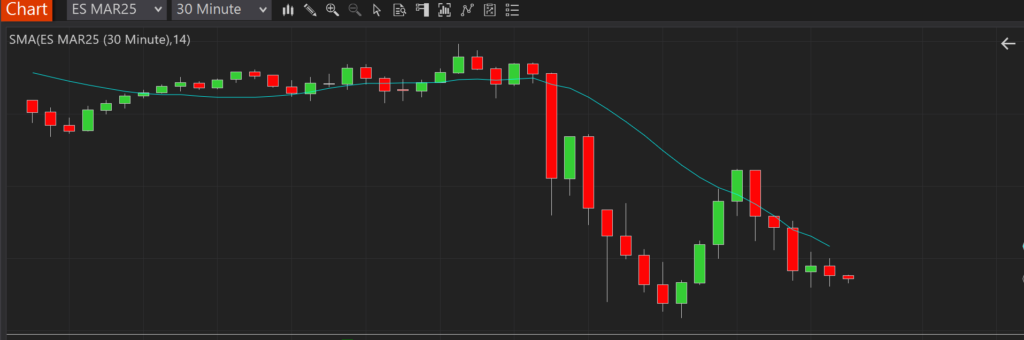
Everyone is likely familiar with the simple moving average (SMA). In trading, it is a lagging indicator used to visualize the average trend of price action over windows of time. Below is a chart with the SMA(14) plotted on it. Each data point corresponds with the average closing price of the 14 closing prices preceding it.
As you can see, the SMA(14) follows the general trend of the chart, but one thing is clear: it’s always lagging behind the actual price movement:
Visually, it appears that the SMA is shifted right of the price bars. In essence, they are, because the SMA lags. Also, since the SMA is an average of the previous prices, the curve is smoother and seems to travel somewhere close to the middle of the price action. Averages being averages, however, this will not always be the case.
So what can we do?
If moving averages are lagging, is there any way we can use them to predict the next value? Actually, there is.
Going back to geometry class, one might remember computing the slope of a line: y = dy / dx. The concept is simple enough: compute the difference in the average from the T-1 time to the T-(Tx+1) time. In our case, since we are assuming 14 time periods, then it would be T-15. The difference in time would then be 14, because there are 14 time periods separating time period T-1 from time period T-15.
Analysis
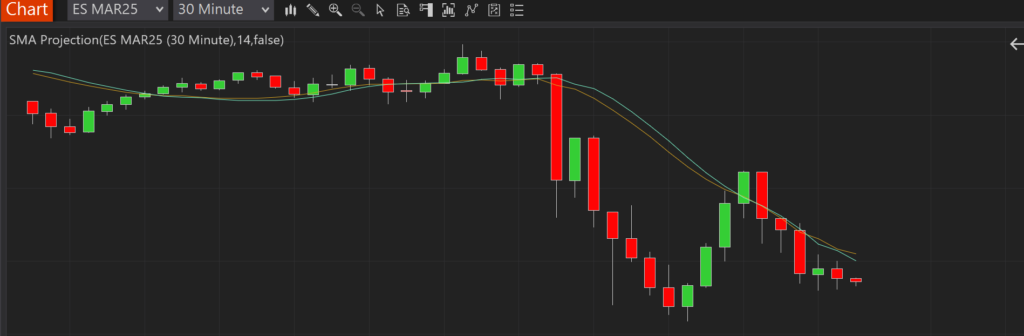
Given the above formula, let’s look at something we shall call the “SMA Projection”, because it can be used to project or predict the next value in the series based on the calculation of average price changes over time.
The color scheme above is a little different than earlier. This time, the goldenrod color is the SMA(14), and the aqua color is our SMA(14) projection.
Following the SMA(14) with the projection, we can consider a couple questions:
How far away from our projections were we compared to the SMA that was ultimately calculated? The closer we are, the less volatility there is, and the more accurately we have predicted where the average is moving.
How far away from our projections were we compared to the actual closing price? Again, the closer we are, the less volatility there is, and the more accurately we have predicted where price action is moving.
Can we trade based on this?
Looking closely at the above charts, it is possible to surmise some patterns that could lead to profitable trades:
If the open is below the prediction but the slope of the prediction is increasing, we could assume that price action is beginning to move upward in the direction of the averages, and we should enter long.
Conversely, if the open is above the prediction but the slope of the prediction is decreasing, we could assume that price action is beginning to move downward in the direction of the averages, and we should enter short.
Looking at the charts, we can see several possible opportunities like this. We can also see that there are several false positives as well.
Do we use this?
Personally, I would not use this as a very effective predictive measure on its own. Combined with Bollinger bands, it may be more effective, but it is still based on lagging data. The lag can be improved by shortening the time period of the SMA, but then it becomes more like looking at current price action rather than trends. If you want to play with that, however, you can try several, maybe starting with a period length of 5 rather than 14.
Conclusion
The point of this article was to serve as an easy-to-understand introduction to predictive analytics. Most people understand moving averages, and the simple moving average is the easiest of them all to grasp.
So what exactly is happening, and how can we leverage it? Well, predictive analytics basically involves determining the slope of a “line” or some other higher-dimensional surface and then predicting the next value on that surface by following the slope. Even when reaching the level of neural networks, although the math becomes more complicated, a slope is ultimately determined, and we use it to compute which category our next predicted data point is at time T. Although, in the case of neural networks, the opposite question can be asked: given actual input appearing right now, what category is it?
What’s next?
In our next article, we will continue to explore the SMA Projection in code. This will allow readers to become familiar with coding and the basic math involved before we begin moving to more advanced models.
Update, November 2026: we published a fix to the SMA Projection indicator. T-1 back to T-15 spans 14 bars, but the code divided by 13, overstating the slope. The formula above is the corrected version; see the fix on GitHub for the original.