
In the last portion of our three-part series, we will be reviewing some of the code behind the Simple Moving Average (SMA) and Exponential Moving Average (EMA) predictive indicators that we have developed. Specifically, we will spend a little bit of time looking at the EMA Projection and the EMA Projection Trend indicators, since these have seemed to be the most useful ones thus far.
Before we get into it, I would like to introduce you to the Huddle, a place where we can crowd around, look at quantitative analytics code, and share ideas. Think of it as a community of ideas and concrete code in a format that is a bit less formal than a traditional code repository might be.
EMA Projection
First up, we have the EMA Projection, which is just our standard EMA plus a projection of where it should land at the current T0. It can make that projection two ways. The first, AverageSlope, takes the gross slope of our line as
m = dx / dy
dx = EMA_at_T_minus_1 - EMA_at_T_minus_period_minus_1
dy = Period  # T-1 back to T-(Period+1) spans
             # exactly Period bars
The second, PriceHold, is the default. It asks a simpler question: where would the EMA land if this bar closed exactly where the last one did? Thanks to how the EMA is built, that works out to the last bar’s slope, scaled down a little:
k = 2 / (Period + 1)  # the EMA's own weight
m = (1 - k) * (EMA_at_T_minus_1 - EMA_at_T_minus_2)
Specifically, the code that matters looks more like this in the real deal:
int lookback = ProjectionMethod == EMAProjectionMethod.AverageSlope ? Period + 1 : 2;
if (CurrentBar < lookback) {
	return;
}

double ema1 = ema[1];
double slope;
if (ProjectionMethod == EMAProjectionMethod.AverageSlope) {
	// ema[1] back to ema[Period + 1] spans Period bars.
	double emaX = ema[Period + 1];
	slope = (ema1 - emaX) / Period;
} else {
	// PriceHold: if this bar closes where the last one did, the EMA moves by
	// k * (Input[1] - ema1), which by the EMA's recursion is (1 - k) * (ema1 - ema2).
	double k = 2.0 / (1 + Period);
	double ema2 = ema[2];
	slope = (1 - k) * (ema1 - ema2);
}
Projection[0] = ema1 + slope;
Specifically, ema is an EMA object that calculates our exponential moving average for us already. We do not have to perform all of that work again.
Period is a property that is passed into the object at runtime, and Projection is a time-series plot added to the object at runtime. By default, Period is 14.
As you can see, there’s nothing complicated about this code. The entire algorithm is really only a couple lines if you were to “golf” that code, but let’s leave it as it is for readability.
The AverageSlope method calculates the gross slope of the line over the last Period bars. We backtested it on ES futures and SPY against faster estimates, and that average lags: it pointed the wrong way on roughly 30% of bars and took a median of three to four bars to follow a turn. PriceHold had about half its error, which is why it is now the default. AverageSlope is still there if you want to compare the two.
EMA Projection Trend
Building on the code from the EMA Projection, we have the EMA Projection Trend. It is a simple extension to the EMA Projection, but it provides a much clearer view of momentum. Specifically, it shows the changes in the slope of our EMA Projection as a proxy of momentum, which is a proxy of volatility, where larger bars indicate more change in the trend.
Altogether, this indicator seems to respond well to trend changes and can let us catch rides after it confirms other leading indicators. At least I have enjoyed using it.
Without further delay, here is the entire algorithm:
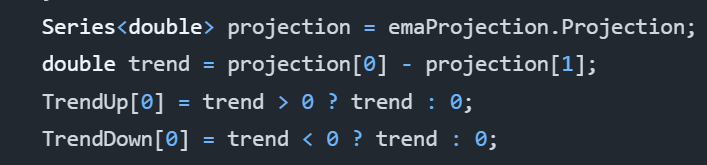
As one can tell, it uses our EMA Projection. It performs a simple comparison of the T0 projection to the most recent prior projection at T-1. This shows us the trend and lets us see the momentum of our projection as it progresses.
The reason for TrendUp and TrendDown calculations being separate is because they are actually two different time-series plots. This allows us to choose distinct colors and is how we can show both green and red bars efficiently.
That’s All!
And with that, that’s all we have for today. This series is really supposed to be a three-part series, but having written what I have, I believe there is the possibility of some more talk on using moving averages as leading indicators.
Update, November 2026: we published a fix to the EMA Projection indicator. Its slope divided the change over Period bars by Period - 1, overstating it, and a backtest showed that averaged slope lagging, so the projection now defaults to PriceHold. The code above is the corrected version; see the fix on GitHub for the original and the backtest.
Leave a Reply